
Figures & data

Figure 1 Contrast imaging of primary liver lesions on MRI subsequent to sorafenib-regorafenib therapy combined with sintilimab. (A) The largest liver lesion in Segment 6 at admission. (B) A posterior portal vein tumor thrombus indicated by the arrow at admission. (C) Tumor in Segment 6 is rendered inactive by treatment. (D) Disappearance of PVTT.
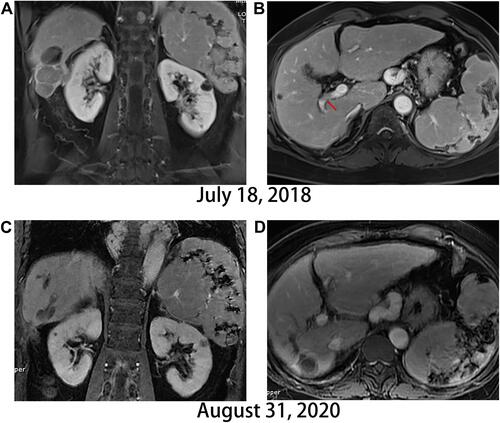
Figure 2 Evolution of HCC lung metastasis. (A and B) No signs of metastasis at admission, (C and D) Multiple lung lesions after therapy with sorafenib for 1 year, (E and F) Volume of lung lesions decrease after treatment with regorafenib combined with sintilimab for 3 months. (G and H) Complete remission of lung metastasis.
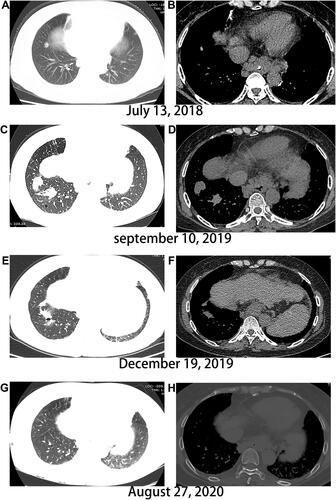
Figure 3 Evolution of the primary liver lesion on computed tomography. (A) Liver lesion in Segment 6 at admission, (B and C) Changes in the segment 6 lesion post-microwave irradiation, (D and E) The tumor continually progresses. (F) Main portal vein tumor thrombus emerges. Red arrow indicates main portal vein tumor thrombus.
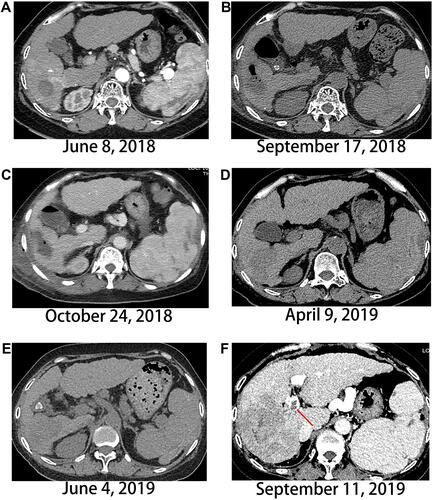
Figure 4 Evolution of the scalp and skull metastasis on computed tomography and whole-body bone scan by single-photon emission computed tomography (SPECT) using 99mTc. (A and B) the scalp and skull metastases occur on the frontal site, (C and D) the scalp and skull lesions shrink significantly, (E) SPETCT shows no active signal at admission, (F) SPECT indicates frontal skull marked by arrow, left sacroiliac joint, and left iliac increased radioactivity, (G and H) radioactivity of the skull disappears.
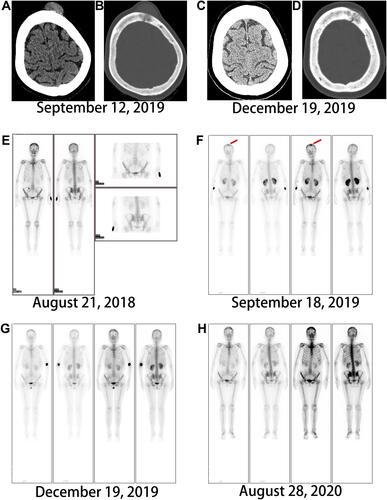
Figure 5 AFP levels over time. The first red arrow indicates the treatment of laparoscopic microwave and sorafenib after finding AFP level is 46,502 ng/mL, and second red arrow indicates the use of regorafenib and sintilimab after AFP level elevates to more than 65000ng/mL.
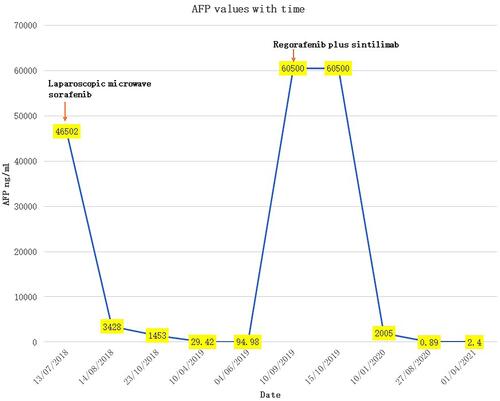
Table 1 Clinical Characteristics of the Reported HCC Scalp and Skull Metastasis