Figures & data
Figure 1 All images are obtained from the same investigated rabbit. (A0) CT scanning image shows normal tissue in the lung before tumor inoculation. (A1) CT enhancement scanning image shows an irregular soft tissue mass in the lobe of the left lung two weeks after tumor inoculation (red arrow). CT perfusion scanning images show PEI (A2), PV (A3), and BV (A4). (B1) MRI enhanced scanning image shows an irregular soft tissue mass in the right lung two weeks after tumor inoculation (red arrow). MR perfusion scanning images show WIR (B2), WOR (B3), and MER (B4) in the tumor tissue (red arrows). There is an abundant supply of blood vessels in the tumor rim, while the central portions of the tumor are ischemic.
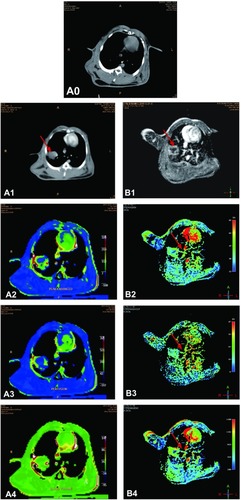
Figure 2 PV and BV increased when the tumor rim was in the range of 0.59–1.69 cm (0.35–2.85 cm2) in size; at 0.59–0.77 cm (0.35–0.6 cm2), PEI increased; at 1.69–1.79 cm (2.85–3.2 cm2), PV and BV decreased and PEI increased; at 1.79–2.10 cm (3.2–4.4 cm2), PV, BV, and PEI increased markedly; at 2.10–2.51 cm (4.4–6.3 cm2), PV and PEI decreased and BV stabilized (A–C). When the central portion of the tumor was in the range of 0.59–1.79 cm (0.3–3.2 cm2), PV, BV, and PEI increased significantly; at 1.79–2.19 cm (3.2–4.8 cm2), PV, BV, and PEI decreased significantly; at 2.19–2.51 cm (4.8–6.3 cm2), PV and BV increased slowly and PEI decreased slowly (D–F).
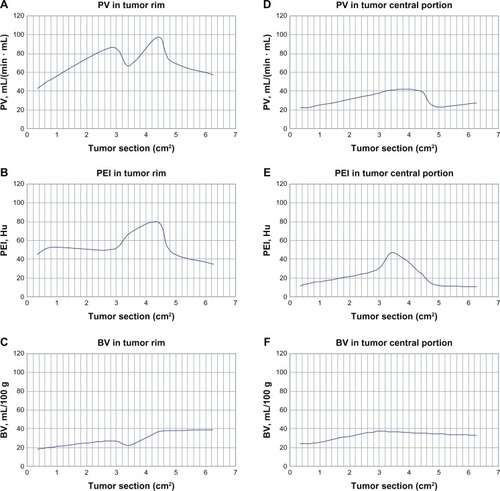
Figure 3 WIR, WOR, and MER increased significantly when the tumor rim was in the range of 0.59–0.77 cm (0.35–0.6 cm2); at 0.77–1.73 cm (0.6–3.0 cm2), WIR decreased slowly, WOR decreased markedly, and MER increased markedly; at 1.73–1.84 mm (3.0–3.4 cm2), WIR decreased, WOR decreased significantly, and MER stabilized; at 1.84–2.10 mm (3.4–4.4 cm2), WIR increased, WOR stabilized, and MER decreased markedly; at 2.10–2.19 cm (4.4–4.8 cm2), WIR decreased markedly, WOR stabilized, and WER decreased markedly; at 2.19–2.51 cm (4.8–6.3 cm2), WIR increased significantly, WOR decreased, and MER stabilized (A–C). When the central portion of the tumor was in the range of 0.59–0.77 cm (0.3–0.6 cm2), WIR, WOR, and MER increased significantly; at 0.77–1.73 cm (0.6–3.0 cm2), WIR decreased smoothly and WOR and MER increased significantly; at 1.73–1.85 cm (3.0–3.4 cm2), WIR increased smoothly, WOR decreased, and MER increased markedly; at 1.85–2.10 cm (3.4–4.4 cm2), WIR stabilized, WOR increased smoothly, and MER decreased markedly; at 2.10–2.19 cm (4.4–4.8 cm2), WIR, WOR decreased markedly, and MER increased significantly; at 2.19–2.51 cm (4.8–6.3 cm2), WIR increased significantly, WOR increased slowly, and MER stabilized (D–F).
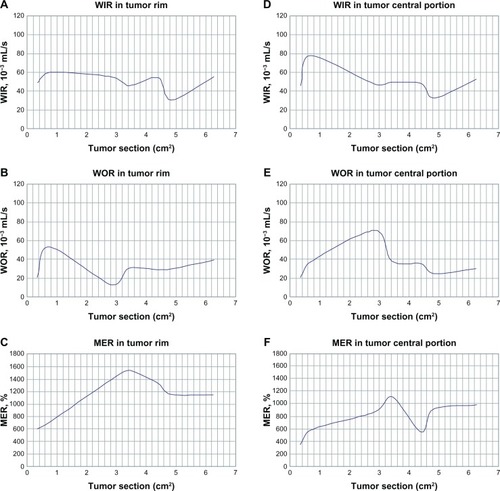
Table 1 Computed tomography perfusion parameters in a rabbit model of VX2 lung cancer
Table 2 Magnetic resonance perfusion parameters in a rabbit model of VX2 lung cancer
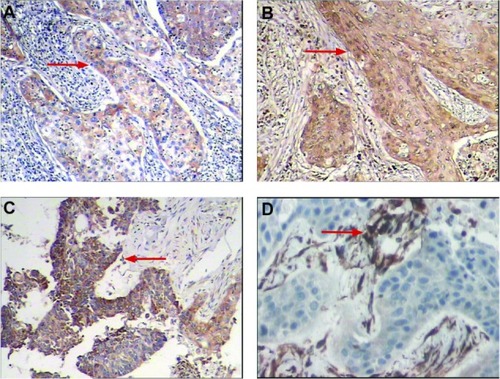
Figure 4 (A) Immunohistochemical staining for positive expression of VEGF. The cytoplasm of tumor cells was stained brown (red arrows). (A) VEGF(+)(SP × 100), (B) VEGF(++)(SP × 100), (C) VEgF(+++)(SP × 100), and (D) positive expression of CD34. Vessels were stained brown and high microvessel density was apparent (SP × 200).