Figures & data
Figure 1 Arsenic trioxide induced apoptosis in CD24+CD44+ SW1990 cells.
Abbreviation: PI, propidium iodide.
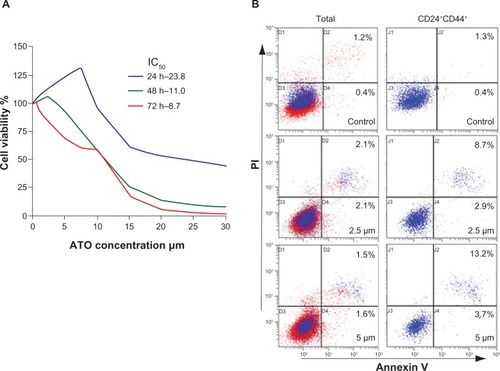
Table 1 Apoptosis in SW1990 cells treated with arsenic trioxide (percentage, mean ± standard deviation)
Figure 2 Arsenic trioxide inhibited tumorigenesis of SW1990 cells in vivo.
Abbreviations: ATO, arsenic trioxide; gem, gemcitabine hydrochloride.
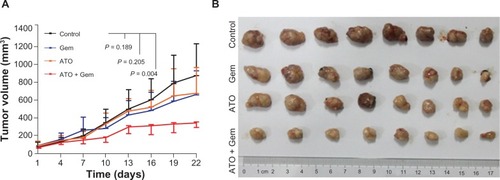
Figure 3 Alterations in apoptosis signaling in xenograft tumor samples and illustration of the potential mechanism.
Abbreviations: AlDH1A1, aldehyde dehydrogenase 1 family, member A1; ATO, arsenic trioxide; Gem, gemcitabine hydrochloride; H&E, hematoxylin and eosin; MOD, mean optical density; TUNEL, terminal deoxynucleotidyl transferase dUTP nick end labeling.
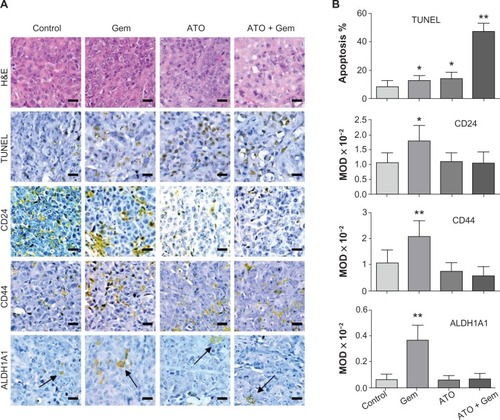
Table 2 Apoptosis in tumors of each group analyzed by terminal deoxynucleotidyl transferase dUTP nick end labeling assay (percentage, mean ± standard deviation)
Table 3 Mean optical density analysis on the immunohistochemistry slides (×10−2, mean ± standard deviation)
Figure 4 Arsenic trioxide binds to Gli1.
Abbreviations: equ, molar equivalents versus the concentration of recombinant Gli1 zinc finger peptides in the solution examined; GFP, green fluorescent protein.
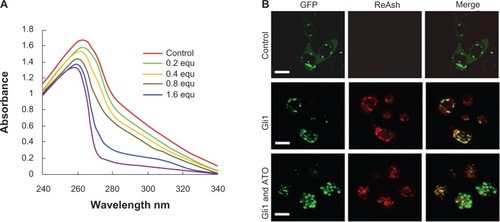
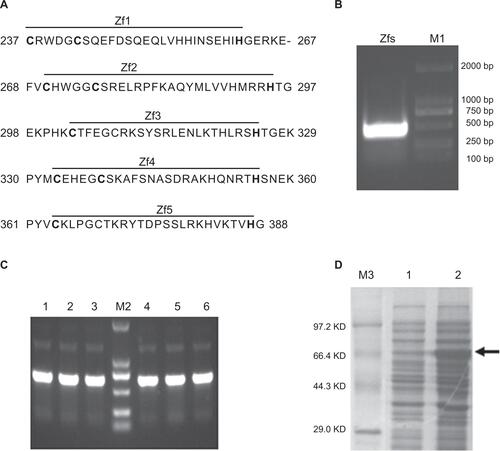
Figure S1 Gli1 zinc finger peptide synthesis.
Notes: (A) The amino acid sequence of the five zinc finger motifs of the Gli1 protein. The “–” symbol indicates a gap. (B) Restriction enzyme analysis of the recombinant plasmid pMAL-C2X-Gli1-Zf by EcoRI and HindIII. Lane M1, Dl-2000 DNA marker; lane 1, products of the recombinant pMAL-C2X-Gli1-Zf plasmid digested with EcoRI and HindIII. (C) Polymerase chain reaction analysis of the cloned strains. Lane M2, DL-2000 DNA marker, lanes 1–6, products of the six clones. (D) SDS-PAGE: Lane M3, TaKaRa protein marker (broad); lane 1, uninduced cell pellet; lane 2, induced cell pellet containing the Gli1 zinc finger motifs as indicated by the arrow.
Abbreviations: Zfs, zinc finger motifs; SDS-PAGE, sodium dodecyl sulfate polyacrylamide gel electrophoresis; Bp, base pair; KD, kilo-Dalton.