Figures & data
Figure 1 Comparison of age at onset for NHL patients according to (A) sex and (B) TNM classification with Kaplan–Meier methods.
Abbreviations: NHL, non-Hodgkin lymphoma; TNM, tumor node metastasis.
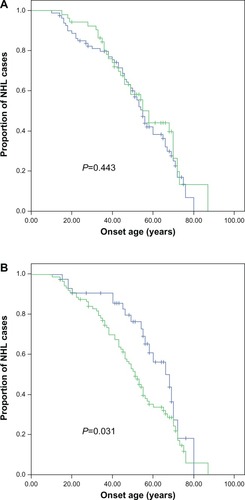
Table 1 Onset age distribution in NHL patients
Table 2 Clinical characteristics and their association with onset age in NHL patients
Figure 2 Comparison of age at onset for NHL patients, according to the genotype of nucleotides 146, 151, 194, 16261, 315, 523, and 525 in the mitochondrial D-loop, using the Kaplan–Meier method.
Abbreviations: D-loop, displacement loop; NHL, non-Hodgkin lymphoma.
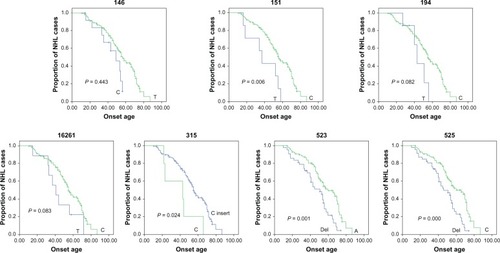
Table 3 Polymorphic sites of the D-loop and their association with onset age in NHL patients
Table 4 Multivariate analysis of predictors associated with age at onset of NHL patients