Figures & data
Figure 1 Differences in global DNA methylation pattern in lung cancer between smokers and nonsmokers. The global DNA methylation pattern in normal lung tissues from smokers (SLT) was compared with that from nonsmokers (NSLT), producing 90 differentially methylated regions. The global DNA methylation pattern of lung tumor tissues from smokers (STT) was compared with that from nonsmokers (NSTT), resulting in 137 differentially methylated regions. Twenty-seven loci can be found in both result sets. The numbers of hypermethylation and hypomethylation loci are also shown. Abbreviation: vs, versus.
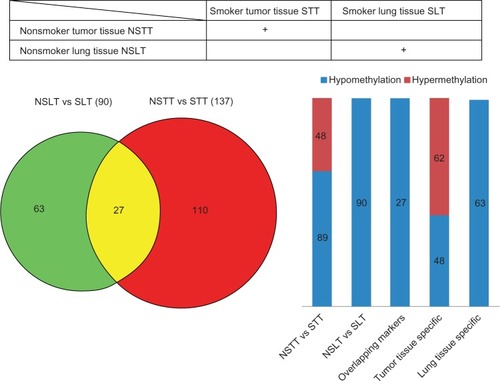
Figure 2 Hypothesized model of smoking-induced lung cancer based on our data.
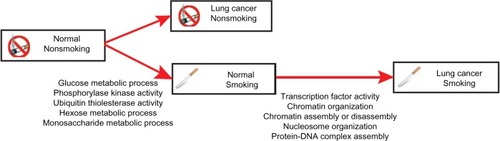
Table 1 Pathways enriched with differentially methylated genes from the comparison between normal lung tissues from smokers and nonsmokers
Table 2 Pathway enrichment analysis for smoking-induced lung cancer-specific differentially methylated genes
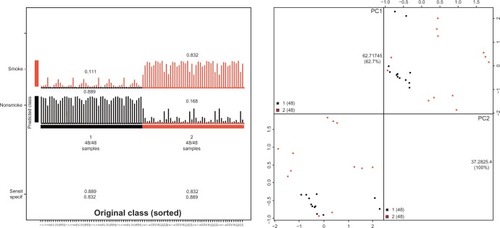
Figure 3 Diagnostic model for classifying smoking-associated lung cancer and nonsmoking lung cancer.
Abbreviations: PC, principal component; Sensit, sensitivity; specif, specificity.