Figures & data
Figure 1 Expression and enzyme activity of three subunits of RR were upregulated in clinical cervical cancer tissues. (A) Levels of RRM1/β-actin, RRM2/β-actin, and RRM2B/β-actin in paired cervical cancer and adjacent normal tissues from 45 cervical cancer patients. Nonparametric paired (Wilcoxon signed-rank) testing indicated significantly higher levels of RRM1, RRM2, and RRM2B mRNA expression in cancer tissues compared with normal tissues. ***P<0.0001. (B) Western blot results for RRM1, RRM2, and RRM2B protein levels in the paired cancer (C) and adjacent normal (N) tissues from eight representative cervical cancer patients. (C) RR enzyme activity measured in paired cancer and adjacent normal tissues from eight representative cervical cancer patients.
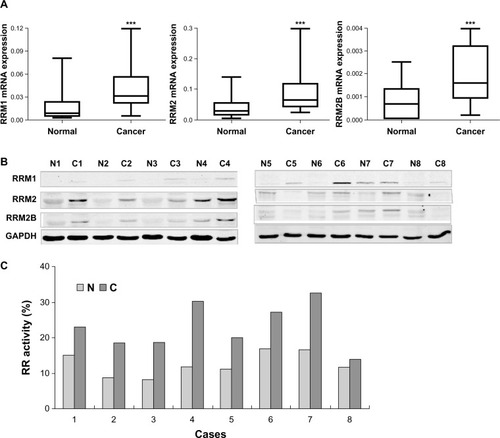
Figure 2 Gemcitabine decreased cell viability and inhibited DNA synthesis in cervical cancer cells. (A) Cells were treated with the indicated concentrations of gemcitabine for 72 hours, and cell viability was measured with Cell Counting Kit-8 viability assays. (B) SiHa cells were exposed to gemcitabine (0, 2, and 4 μmol/l) for 12 hours. The percentage of EdU (5-ethynyl-2′-deoxyuridine) incorporation was calculated as the number of EdU-positive nuclei (red) divided by the total nuclei (blue), the total nuclei were counterstained with DAPI. (C) We selected ten visual fields under the fluorescent microscope and calculated more than 10,000 cells for each well. Counting was carried out by imageJ software. *P<0.05 for the treatment compared with the control.
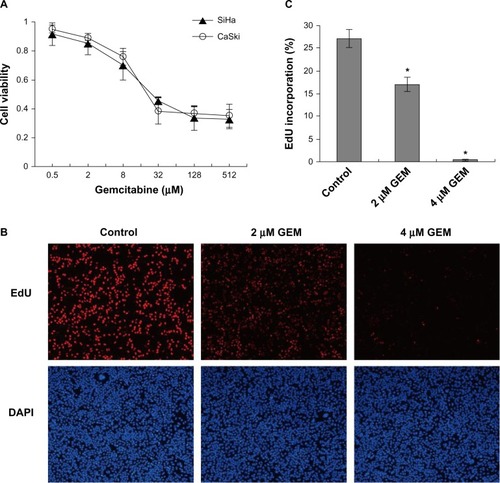
Figure 3 Carboplatin reduced cell viability and induced DNA damage in cervical cancer cells. (A) SiHa and CaSki cells were treated with the indicated concentrations of carboplatin for 72 hours, and cell viability was measured by Cell Counting Kit-8 viability assay. (B) Carboplatin induced DNA damage in SiHa cells. SiHa cells were exposed to 20, 40, and 80 μmol/L carboplatin for 12 hours, respectively. Immunofluorescence analysis was used to detect nuclear γ-H2AX foci formation with anti-H2AX antibody (red, fluorescein isothiocyanate). Nuclei were counterstained with DAPI (blue). (C) γ-H2AX-positive cells were counted under a fluorescent microscope. We calculated more than 1,000 cells for each well. Quantitative data are represented the mean ± standard deviation of three individual experiments.
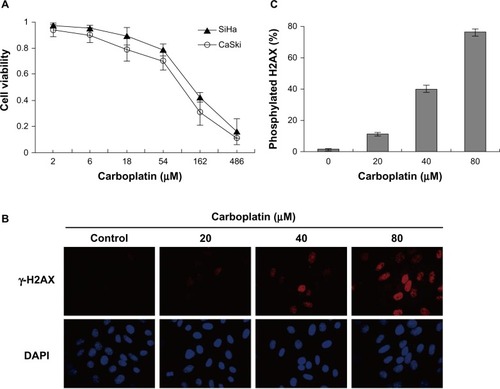
Figure 4 Synergistic cytotoxicity of gemcitabine combined with carboplatin in cervical cancer cell lines. (A) SiHa and CaSki cells were seeded into 96-well plates and treated with gemcitabine or/and carboplatin at the indicated concentrations. After 72 hours, cell viability was measured using the Cell Counting Kit-8 viability assay. The data shown represent the mean ± standard deviation (n=3). (B) The synergistic effect of gemcitabine combined with carboplatin was quantitatively analyzed with a Cl and expressed as log10(CI) versus fractional effect Where calculable, 95% confidence intervals are shown.
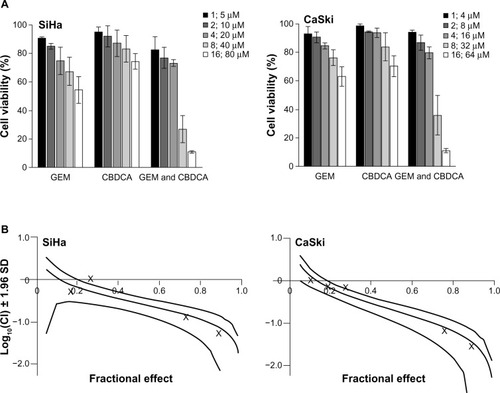
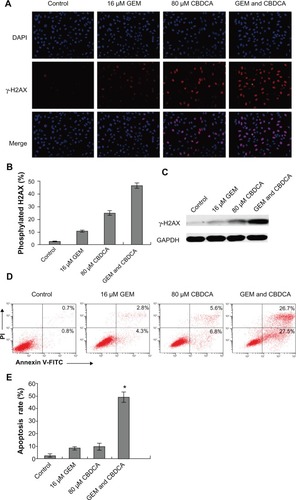
Figure 5 Gemcitabine enhanced carboplatin-induced DNA damage and apoptosis in cervical cancer cells. (A) SiHa cells were treated with gemcitabine or/and carboplatin for 6 hours. Immunofluorescence analysis was used to detect γ-H2AX expression. (B) The quantitative data from and γ-H2AX-positive cells were calculated as (*P<0.05). (C) SiHa cells were treated with the indicated drugs for 6 hours. γ-H2AX protein expression was analyzed by Western blotting. (D) SiHa cells were treated with the drugs indicated for 72 hours. Apoptosis was analyzed by Annexin V-fluorescein isothiocyanate (FITC)/propidium iodide (PI) double staining assay. (E) The degree of apoptotic cell death was quantified for each condition. Data represented the mean ± standard deviation of three individual experiments (*P<0.05).