
Figures & data
Figure 1 In vitro screening of natural compounds.
Abbreviations: IC50, inhibitory concentration; dGTP, deoxyguanosine triphosphate.
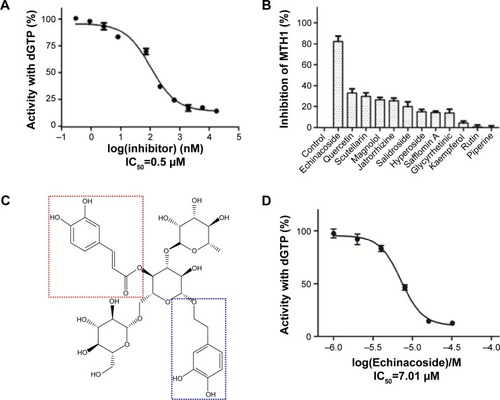
Figure 2 Examination of cellular 8-oxoG, ROS, and DNA damages.
Abbreviations: 8-oxoG, 8-oxoguanine; ROS, reactive oxygen series; DAPI, 4′,6-diamidino-2-phenylindole; DCFH-DA, dichloro-dihydro-fluorescein diacetate; h, hours.
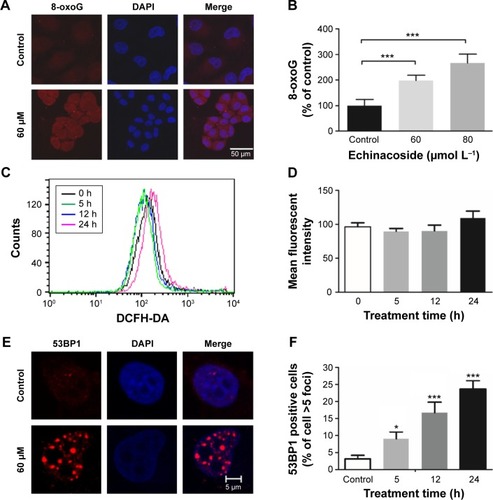
Figure 3 Analysis of cell growth and proliferation.
Abbreviations: MTT, 3-(4,5-dimethylthiazol-2-yl)-2,5-diphenyltetrazolium bromide; IC50, inhibitory concentration; h, hours; OD, optical density.
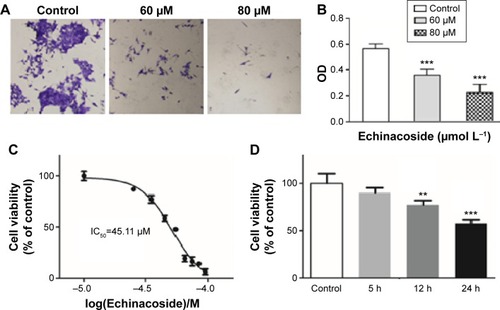
Figure 4 Analysis of cell cycle.
Abbreviations: h, hours; GAPDH, glyceraldehyde 3-phosphate dehydrogenase.
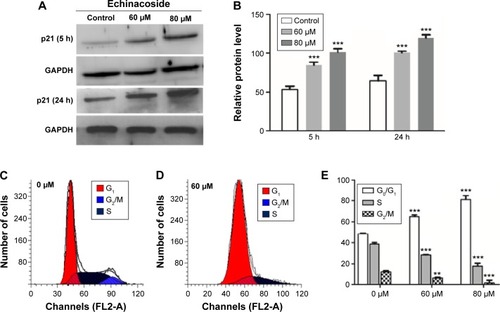
Figure 5 Analysis of apoptosis.
Abbreviations: PARP, poly (ADP-ribose) polymerase; h, hours; DAPI, 4′,6-diamidino-2-phenylindole; GAPDH, glyceraldehyde 3-phosphate dehydrogenase.
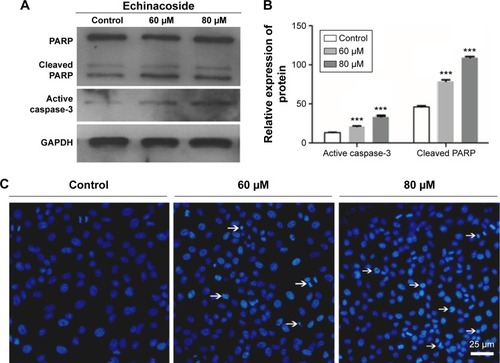
Figure 6 Induction of apoptosis by Echinacoside.
Abbreviations: h, hours; PI, propidium iodide; FITC, fluorescein isothiocyanate.
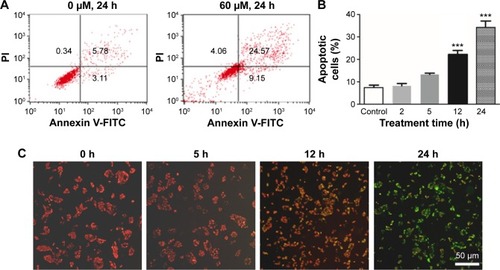
Figure S1 Examination of cellular 8-oxoG and apoptosis.
Notes: (A) Detection of 8-oxoG by a monoclonal anti-8-oxoG antibody: 8-oxoG signal was revealed by an Alexa 488-conjugated secondary antibody, and treatment of MG-63 cells with 60 μM and 80 μM Echinacoside for 24 h increased the level of 8-oxoG; (B) analysis of cancer cell DNA by electrophoresis on 2% agarose gel: treatment of MG-63 cells with 80 μM Echinacoside for 24 h produced a typical apoptosis ladder pattern; and (C) immunofluorescent staining of active caspase-3: strongly activated caspase-3 signals were detected in MG-63 cells treated with 60 μM Echinacoside for 24 h.
Abbreviations: 8-oxoG, 8-oxoguanine; h, hours; DAPI, 4′,6-diamidino-2-phenylindole.
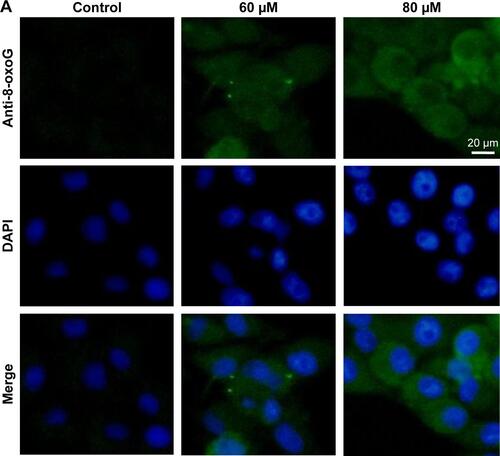
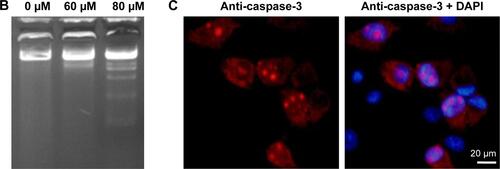
Figure S2 Flow cytometry analysis of apoptosis in noncancer cells.
Notes: (A) Normal human liver L-O2 cells, (B) human embryonic kidney HEK 293 cells, and (C) mouse NIH/3T3 fibroblast cells. Treatment with 60 μM and 80 μM Echinacoside for 24 h did not change the percentage of apoptotic cells in these noncancer cell lines.
Abbreviations: h, hours; PI, propidium iodide; FITC, fluorescein isothiocyanate.
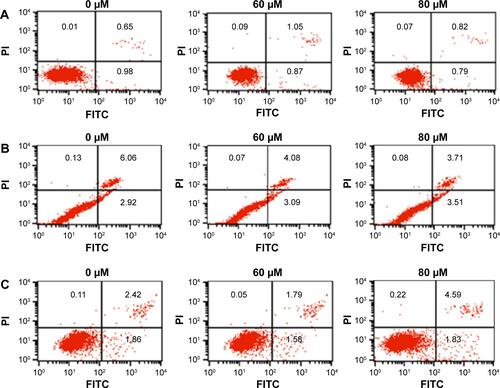
Figure S3 Time-course analysis of apoptosis.
Notes: MG-63 cells were treated with 60 μM Echinacoside for 2 h, 5 h, and 12 h, and significant apoptosis was seen after treatment for 12 h.
Abbreviations: h, hours; PI, propidium iodide.
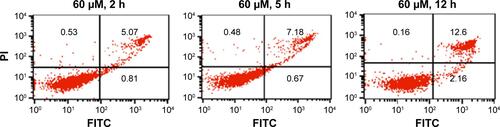
Table S1 List of herbal compounds used in the in vitro screening