Figures & data
Figure 1 Scoping Review Flow Chart. The stages of a scoping review are highlighted, with the number of items evaluated at each step: 1) Identification of articles matching specified Mesh terms in PubMed (N=1,006); 2) Screening of articles using filters for availability and relevance (N=202); 3) Determination of eligibility by additional inclusion/exclusion criteria (N=192); and 4) Characteristics of articles included after the first three steps of identification, screening, and eligibility. These characteristics include whether studies were conducted on a single or multiple population(s), and the number of studies conducted in different biogeographical groups, as measured by ancestral origin or socio-cultural label of the population(s) studied.
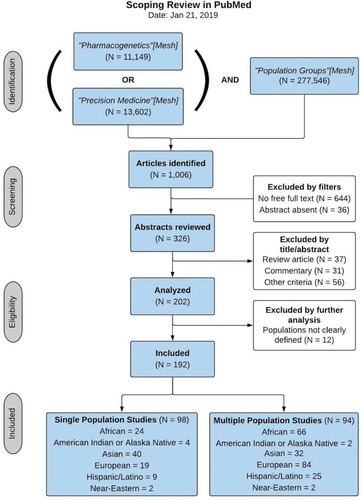
Figure 2 Global Concentrations of Studies by Country of First Author Affiliation. Heat map shows the number of studies included in this scoping review that were conducted in each country, as determined by the location of the first author’s affiliated institution.
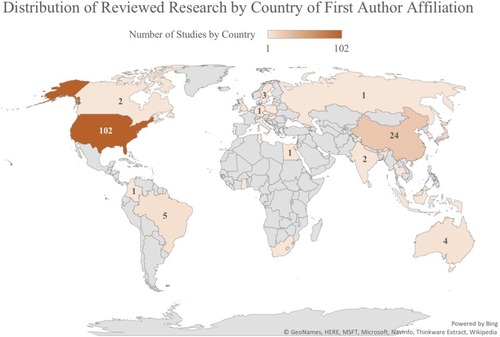
Figure 3 Ancestral Populations Included in Reviewed Research by Geographical Region of First Author Affiliation. For each study, geographical region was determined by pooling countries of first author affiliations into broad continental categories. Each study received a binary indicator of whether or not it included at least one population from each broad ancestral category, so studies with more than one study population received more than one indicator. Therefore, the total number on the Y-axis does not reflect the number of studies, but rather the distribution of populations studied within each geographic region. This graph thus illustrates the representation of ancestral populations in the body of research produced in each of the continental regions of the world.
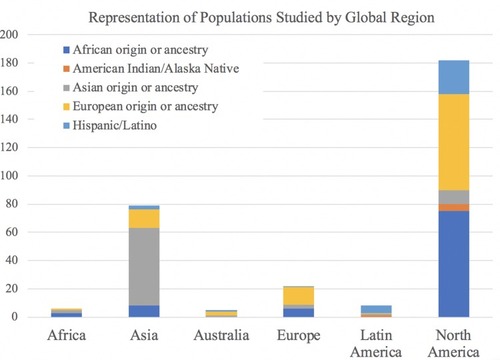
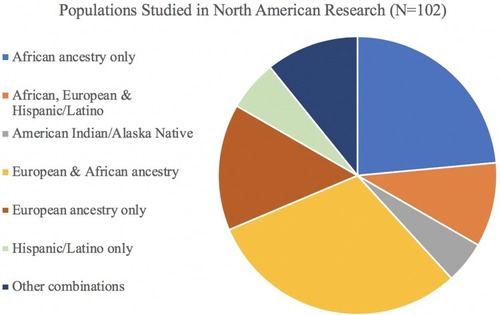
Figure 4 Populations Studied in Research Conducted in North America. Among articles included in the scoping review that had first author affiliations in North America (N=102), this figure illustrates which study populations were involved, both as single-population studies and combined in multiple-population studies. In contrast to , which shows the total number of populations studied, this pie chart shows the distribution and combination(s) of those populations included across the total number of studies conducted in North America.