
Figures & data
Table 1 Primers and PCR conditions used to amplify and sequence the vast majority of genomic sequence including the reported SNPs on VKORC1
Table 2 Descriptive statistics for 90 Emirati individuals treated with warfarin recruited for VKORC1 genotyping
Figure 1 Linkage disequilibrium analysis: a diagram of VKORC1 with the location of selected SNPs (Transcript: VKORC1-205 ENST00000394975.2). Black and blue boxes represent exons (E) and untranslated regions (UTR), respectively. Dark red blocks represent stronger LD than the lighter ones. Values represent pairwise r2.
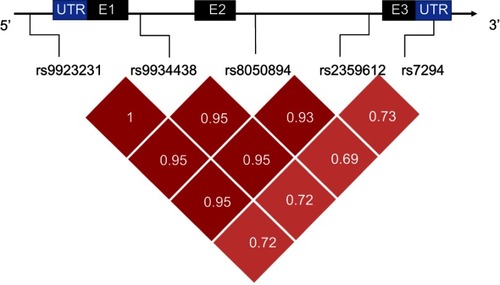
Table 3 Frequencies of minor alleles at the studied SNPs in comparison to allele frequencies in different populations from the 1000 Genomes Projecta
Table 4 Frequencies of genotypes at the studied SNPs and results of ANOVA
Table 5 Analysis of haplotypes and their association with dose
Table 6 Model summary and predictors of logistic regression
Table S1 Results of cross-tabulation