
Figures & data
Table 1 Cohort characteristics and distribution of study outcomes
Figure 1 Stratification result of association for DUOX2 rs2001616. Frequencies of AA and AG+GG genotypes (gray bars) and unaffected (black bars) individuals, as defined by Pmax Z≤−2 SD and Z>−2 SD, respectively. P-value with OR (odds radio) and 95% CI (confidence interval) is presented for each comparison. Number of patients in each genotype group is indicated in brackets with percentages. BMI; non obese: <30 kg/m2, obese: ≥30 kg/m2.
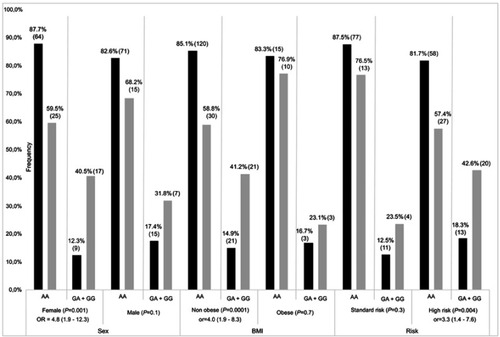
Figure 2 Stratification result of association for ADAMTS rs4127041. Frequencies of GG and GC+CC genotypes for affected (grey bars) and unaffected (black bars) individuals, as defined by Fmax Z≤−2 SD and Z>−2SD, respectively. P-value with OR (odds radio) and 95% CI (confidence interval) is presented for each comparison. Number of patients in each genotype group is indicated on each bar.
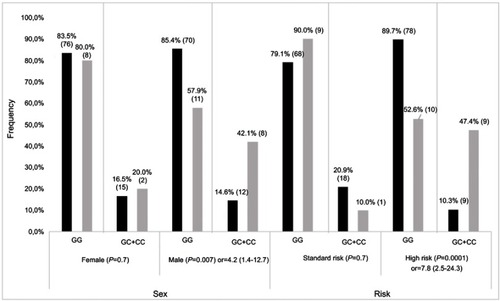
Table 2 Top-ranking common SNPs, genotyping data, and associated phenotypes
Table 3 Regression model
Table 4 Top-ranking rare SNPs, genotyping data, and associated phenotypes
Table S1 Top-ranking common SNPs, WES data
Table S2 Top-ranking rare SNPs, WES data
Table S3 Co-variable association with Pmax (Z-score ≤ −2)
Table S4 Association of risk groups with CRT and cumulative MTX and GC dose