
Figures & data
Figure 1 Association between CYP2D6 phenotypes and Cpss of donepezil at the 10 mg maintenance dose.
Abbrevations: IM, intermediate metabolizers; EM, extensive metabolizers.
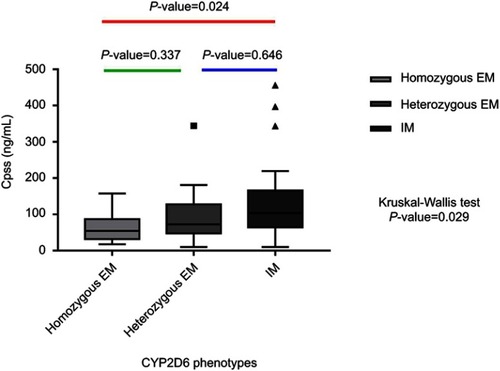
Table 1 Baseline demographic and clinical characteristic of 85 Thai patients with dementia
Table 2 Genotype distribution and allele frequencies of the candidate gene in the study patients
Table 3 Association of the non-genetic factors and Cpss of donepezil at the 10 mg maintenance dose
Figure 2 Association between the combined effect of CYP2D6*10 carriers and concomitant use of memantine on Cpss of donepezil.
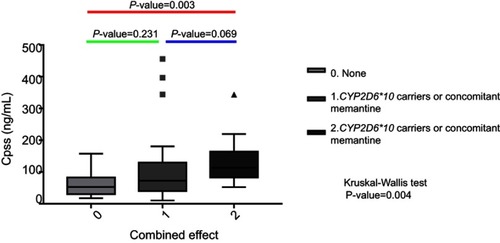
Table 4 The final model of multiple linear regression analysis of explanatory variables for Cpss of donepezil at the 10 mg maintenance dose
Figure 3 Association between CYP2D6 phenotypes and TMSE score at steady state (A) or ΔTMSE score (B) in AD patients.
Abbrevations: TMSE, Thai Mental State Examination score; IM, intermediate metabolizers; EM, extensive metabolizers.
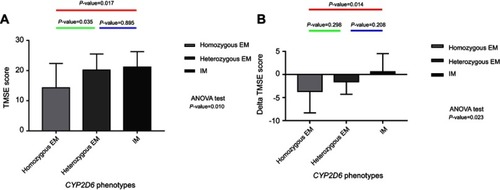
Table 5 The final models of stepwise multiple linear regression analysis of explanatory variables for donepezil treatment outcomes as measured by Thai Mental State Examination (TMSE) score at steady state and ΔTMSE in patients with Alzheimer's disease (AD) and vascular dementia (VAD)
Table S1 Cpss of donepezil and TMSE score in association with CYP2D6, CYP3A5, ABCB1, and APOE genotypes at the 10 mg maintenance dose
Table S2 Association of non-genetic factor and TMSE score of donepezil at 10-mg maintenance dose
Table S3 Bivariate analysis: Association of non-genetic continuous variable and TMSE score