
Figures & data
Table 1 Gender and age-matched distribution in the epileptic patients (n=296) and the control individuals (n=299)
Table 2 The association of CHRM2, CYP3A5, and ZNF498 polymorphisms in epileptic patients (EP) (n=296) and control individuals (n=299)
Table 3 The association of CHRM2, CYP3A5, and ZNF498 polymorphisms in generalized epilepsy patients (GEP) (n=172) and control individuals (n=299)
Table 4 The association of CHRM2, CYP3A5, and ZNF498 polymorphisms in partial epilepsy patients (PEP) (n=124) and control individuals (n=299)
Table 5 The association of ZNF498, CYPA5, and CHRM2 SNPs in good responder (n=124) and poor responder (n=171) patients
Figure 1 Scatter plot from the sequenom data of the studied variants. The scatter plot illustrates rs159690 SNP within ZNF498 gene (A) rs15524 SNP within CYP3A5 (B) and rs420817 and rs324649 SNPs within CHRM2 (C and D, respectively). The X and Y axes denote mass measurements for the two alleles (G, A, low mass allele versus high mass allele) at the rs159690 and rs15524 (A and B, respectively). At (C) and (D) the X and Y axes denote mass measurements for the C, T (low mass allele versus high mass allele) at rs420817 and rs324649 SNPs. Every single sample is represented by one point. The points in the scatter plot are colored depending on the genotype calls.
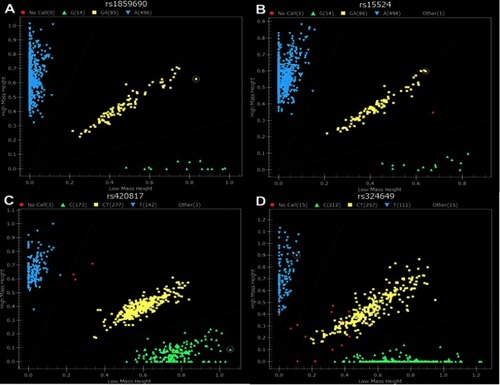
Table 6 The association between CHRM2 (rs324649 and rs420817), CYP3A5 (rs15524), and ZNF498 (rs1859690) and the clinical characteristics
Data availability
The datasets generated and analyzed during the current study are not publicly available. The consent from participants did not cover data sharing but are available from the corresponding author on reasonable request.