
Figures & data
Figure 1 Flowchart outlining the steps of the bioinformatics approach to identify differentially expressed genes in severe asthmatic bronchial epithelium compared to healthy controls.
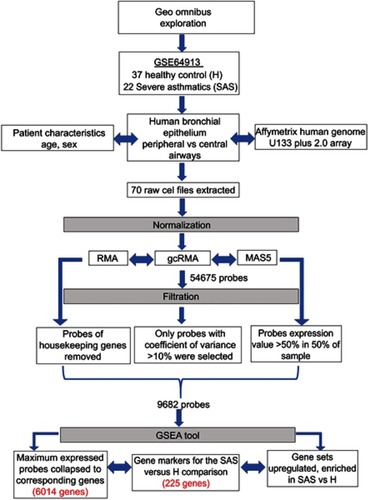
Figure 2 The flowchart of the bioinformatics approach to identify gene sets related to chemical, toxins, and drugs.
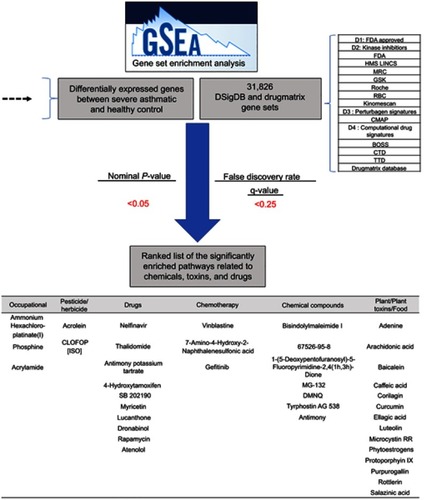
Table 1 Details of datasets extracted from DSigDB and DrugMatrix and used for GSEA
Figure 3 The flowchart outline using the Comparative Toxicogenomics Database (CTD) batch query tool (http://ctdbase.org/tools/batchQuery) to identify common pathways targeted by most of the GSEA-identified chemicals. (A) All the earlier identified drugs and chemicals were uploaded to the query tool to search for genes and (B) pathways that were documented to be affected by queried chemicals. The tool will generate (C) a list of pathways where the given chemical affects genes related to that pathway significantly (adjusted p-value <0.05). (D) Only pathways that are shared by at least 50 percent and above of the identified chemicals are selected.
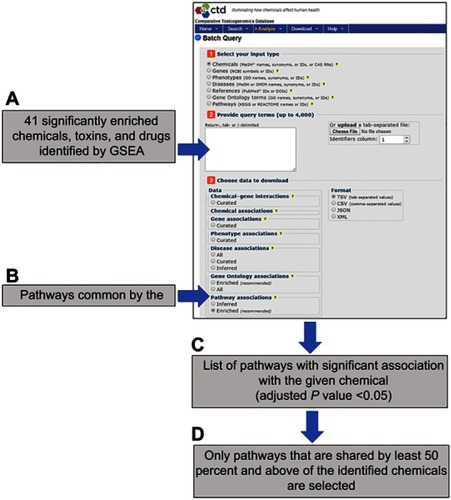
Figure 4 Gene Set Enrichment Analysis (GSEA) of the differentially expressed genes between severe asthmatic bronchial epithelium (n=22) and healthy bronchial epithelium (n=37) in GSE64913. (A) Distribution of the identified genes ranked according to their position (B) Heatmap image generated from the 2952 DEG between severe asthma and healthy controls which were later filtered into 225 genes (C) the top enriched pathways whether upregulated or downregulated in severe asthma compared to healthy controls using metascape (http://metascape.org): a gene annotation and analysis online resource that generates a graphical representation.
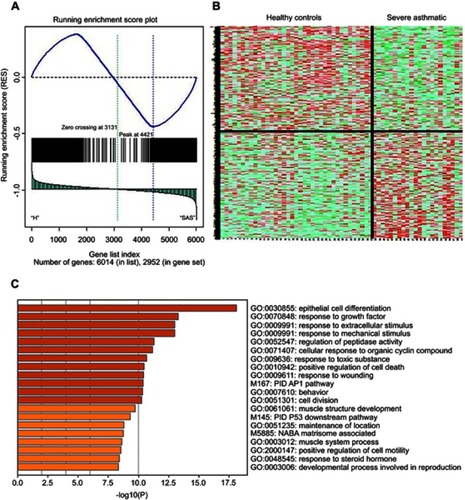
Table 2 List of the significantly enriched pathways related to chemicals, toxins, and drugs for the genes that showed significant differential expression in severe asthmatic bronchial epithelium compared to healthy controls
Table 3 The top enriched chemicals by GSEA categorized into different subgroups
Table 4 List of pathways significantly associated with the largest number of the identified 41 chemicals using Comparative Toxicogenomics Database (CTD) batch query webtool (http://ctdbase.org/tools/batchQuery). Only pathways that are shared by more than 50% of the identified chemicals were listed