
Figures & data
Figure 1 Heatmap and clustering analysis of DEGs. Red: high expression level; Blue: low expression level.
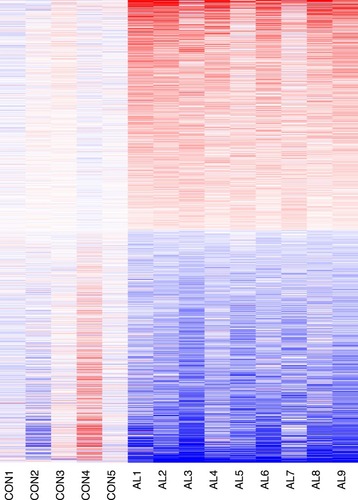
Table 1 Top Five Enriched GO of Downregulated DEGs and Upregulated DEGs
Table 2 The Top Five Enriched KEGG Pathways of DEGs
Figure 2 The giant network consisting of 1270 nodes and 7818 edges was extracted from the whole PPI network. Key nodes in the giant network are highlighted in different colors: red corresponds to the up-regulated gene and green corresponds to the down-regulated gene in AL amyloidosis.
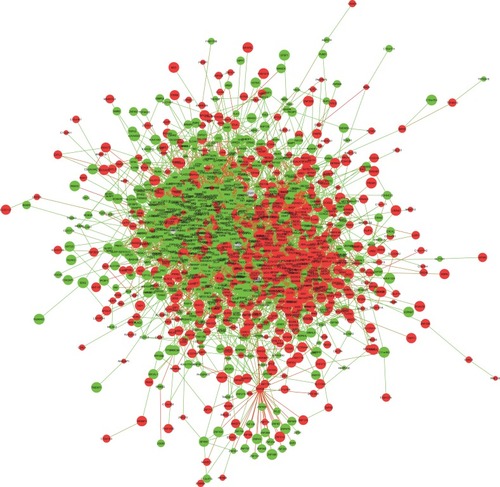
Figure 3 The topology parameters were analyzed according to the giant networks. (A) Degree distribution; (B) average clustering coefficient; (C) shortest path distribution; (D) closeness centrality.
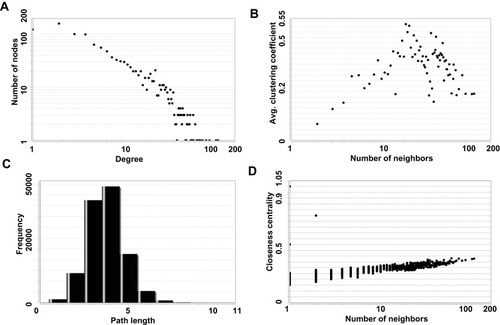
Figure 4 The significant module was extracted from the giant network: (A) red corresponds to the up-regulated gene; (B) green corresponds to the down-regulated gene in NEC.
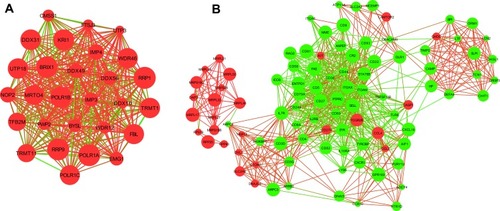
Table 3 The Statistically Significant Sub-Pathways Identified by DEGs (Top 5)
Figure 5 The expression of key genes in AL amyloidosis patients’ clonal plasma cells. (A) FBL and IMP3 were up-regulated in AL amyloidosis patients compared with healthy control; (B) ITGAM, ITGB2 and ITGAX were down-regulated in AL amyloidosis patients compared with healthy control.
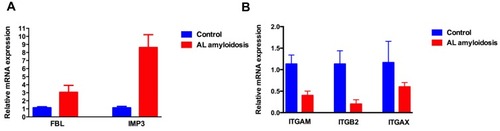
Table 4 The Small Molecular Agents Identified of DEGs (Top 5)