Figures & data
Figure 1 Remodeling of KCa2 channels in atrial fibrillation (AF) patients with concomitant heart failure. (A) Key characteristics of study patients (LA, left atrium; LVEF, left ventricular ejection fraction; see Supplementary Table 1 for details). Please note that patient characteristics have been published previously.Citation1,Citation16–Citation18 (B) Representative apical 4-chamber echocardiography view of a patient with severely reduced LVEF and sinus rhythm (SR). (C) KCNN mRNA levels normalized to glyceraldehyde 3-phosphate dehydrogenase (GAPDH) and respective SR control, obtained from patients with SR, paroxysmal (pAF), or chronic AF (cAF). KCNN1Citation18 and KCNN2/3Citation16 mRNA expression data were reported previously and are shown here for reference. Data are presented as box plots with underlying dots representing raw data; *P < 0.05, **P < 0.01, ***P < 0.001 versus SR controls.
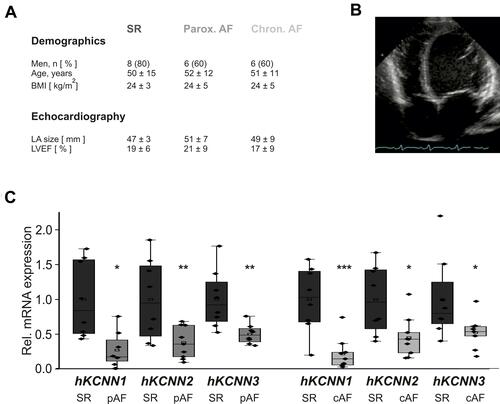
Figure 2 Remodeling of KCa2 channels in a porcine atrial fibrillation (AF)/heart failure model. (A) Representative ECG recordings illustrate AF (right) induced by rapid atrial pacing (left). (B-D) Relative right atrial mRNA expression levels of KCNN1 (B), KCNN2 (C), and KCNN3 (D) are provided for AF pigs after 7 and 14 days of atrial burst pacing compared to sinus rhythm (SR) controls.
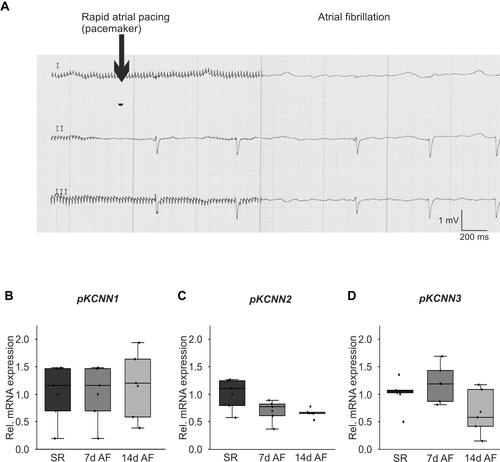
Figure 3 Effects of electrical tachypacing on KCa2 channel expression and viability in HL-1 atrial cells. (A) Representative microscopic images under control conditions (Ctrl) and after 24 h tachypacing (TP), respectively (scale bar, 100 µm). (B) Kcnn1 (n = 6), Kcnn2 (n = 6), and Kcnn3 mRNA expression (n = 6) calculated relative to untreated controls (n = 6 each). (C, D) Remodeling of KCa2.1 (n = 6), KCa2.2 (n = 6), and KCa2.3 protein (n = 6), evaluated using Western blot analyses and compared to controls (n = 6 each). (E, F) Apoptosis of HL-1 cells subjected to tachypacing (n = 3), including untreated (Ctrl; n = 3), positive (Pos. ctrl; n = 2), and negative controls (Neg. ctrl; n = 2). (E) Representative fluorescence microphotographs corresponding to terminal deoxynucleotidyl transferase dUTP nick end labeling (TUNEL) assays (scale bar, 100 µm). Red nuclear fluorescence reflects endonucleolytic DNA degradation and apoptosis. (F) Mean apoptosis rates. TUNEL (Texas Red, TxR)-positive cells are expressed in relation to the total number of cells. Data are provided as box plots with underlying dots representing original data; *P < 0.05 versus HL-1 cells not subjected to tachypacing, ns= non significant.
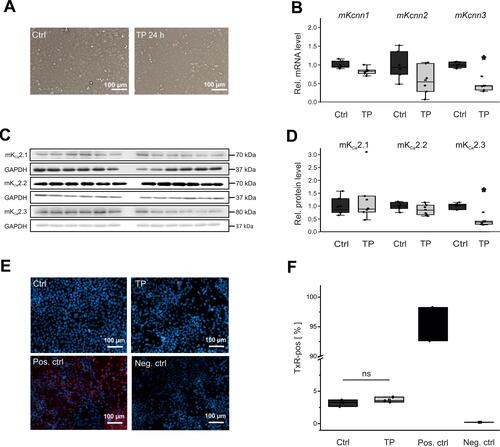
Figure 4 Stretch-related KCa2 channel remodeling in HL-1 cells. (A) Representative microphotographs under control conditions (Ctrl) and after 24 h cell stretch, respectively (scale bar, 200 µm). (B) Kcnn1 (n = 6), Kcnn2 (n = 6), and Kcnn3 mRNA expression (n = 6) relative to untreated controls (n = 6 each). (C, D) Expression of KCa2.1 (n = 6), KCa2.2 (n = 6), and KCa2.3 protein (n = 6) compared with controls (n = 6 each). Data are shown as box plots with underlying dots representing original data; *P < 0.05 versus HL-1 cells not subjected to stretch.
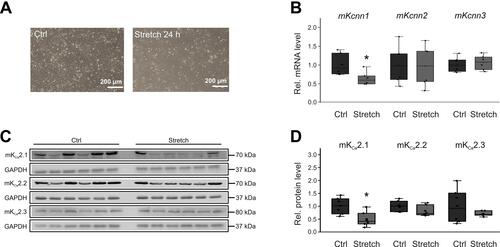
Figure 5 Effects of β-adrenergic stimulation on KCa2 channel expression in HL-1 cells. (A) Representative microphotographs under control conditions (Ctrl) and after incubation with 50 µM isoproterenol for 24 h, respectively (scale bar, 100 µm). (B) Kcnn1 (n = 6), Kcnn2 (n = 6), and Kcnn3 mRNA expression (n = 6) relative to untreated controls (n = 6 each). (C, D) Relative KCa2.1 (n = 6), KCa2.2 (n = 6), and KCa2.3 protein levels (n = 6) compared with controls (n = 6 each). Data are shown as box plots with underlying dots representing original data; ***P < 0.001 versus HL-1 cells not subjected to isoproterenol administration.
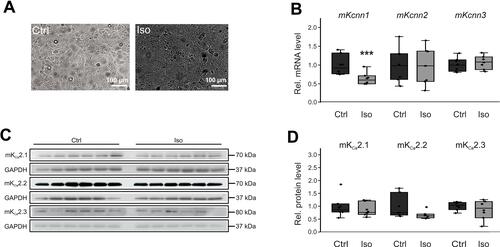
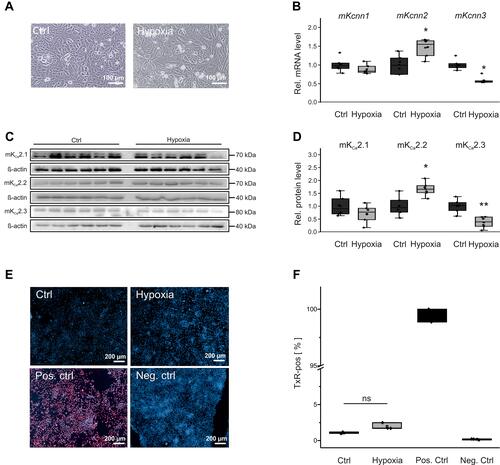
Figure 6 KCa2 channel expression and viability of HL-1 atrial cells during hypoxia. (A) Representative microscopic images under control conditions (Ctrl, 21% O2) and after 24 h hypoxia (1% O2), respectively (scale bar, 100 µm). (B) Kcnn1 (n = 6), Kcnn2 (n = 6), and Kcnn3 mRNA expression (n = 6) calculated relative to untreated controls (n = 6). (C, D) Relative KCa2.1 (n = 6), KCa2.2 (n = 6), and KCa2.3 protein expression (n = 6) during hypoxia and under control conditions (n = 6 each). (E, F) Apoptosis of HL-1 cells subjected to hypoxia, including untreated (Ctrl), positive (Pos. ctrl), and negative controls (Neg. ctrl). (E) Representative fluorescence microphotographs corresponding to TUNEL assays (scale bar, 200 µm). (F) Mean apoptosis ratios. TUNEL (Texas Red, TxR)-positive cells are provided in relation to the total number of cells. Data are given as box plots with underlying dots representing original data; *P < 0.05, **P < 0.01 versus HL-1 cells not exposed to hypoxia.