Figures & data
Table 1 Patient Demographics (n=149)
Table 2 SULT1A1 and UGT2B17 Gene Copy Number (CN) Distribution Among Different Ethnic Populations
Table 3 Relationship Between Genetic Variation in Drug-Metabolizing Enzyme and Transporter Genes and Plasma Efavirenz Concentrations (N=149)
Table 4 Univariate and Multivariate Analyses of Genetic and Non-Genetic Factors Associated with Plasma Efavirenz Concentrations at Week 12 and 24 in HIV-1 Infected Thai Adults
Figure 1 Influence of SULT1A1*2 (c.638G>A) on median plasma efavirenz (EFV) concentrations at week 12 and 24. Dash lines represent the therapeutic window for EFV (1–4 mg/L). (A) Median plasma EFV concentrations compared between groups (p=0.638) at week 12. (B) Median plasma EFV concentrations were significantly lower in heterozygous patients (638G/A; 2.18 mg/L, IQR 1.44–2.60, p=0.048) compared to those not carrying the variant (638G/G; 2.33 mg/L, IQR 1.57–4.21).
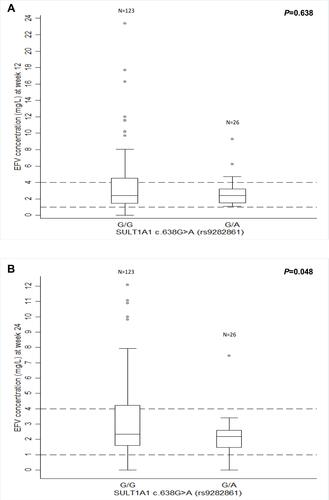
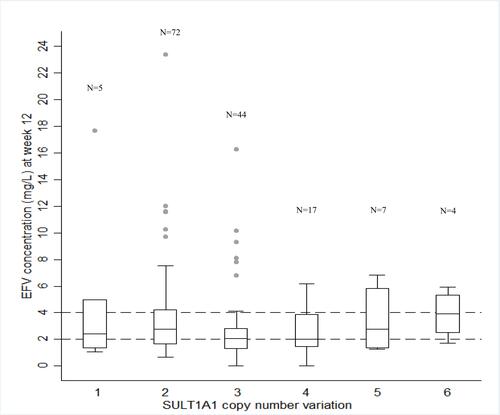
Figure 2 Influence of SULT1A1 copy number variation on median plasma efavirenz (EFV) concentrations at week 12. Dash lines represent the therapeutic window for EFV (1–4 mg/L). A comparison of SULT1A1 copy number (CN) and median plasma EFV concentration at week 12. Median plasma EFV concentrations were significantly lower in patients with CN≥3 (p=0.046), CN=3 (p=0.019), and CN=3+4 (p=0.015) compared to those carrying CN=2.