Figures & data
Figure 1 Merging of datasets and differential expression analysis. (A, B) Two-dimensional principal component analysis cluster plot before and after merging GSE133054 and GSE141910. (C) Volcano plot of 455 DEGs. (D) The number of DEGs filtered using limma according to the cutoff criteria [adjusted P value < 0.05, |log2 FC| ≥ 1]. (E) Heatmap of all DEGs.
![Figure 1 Merging of datasets and differential expression analysis. (A, B) Two-dimensional principal component analysis cluster plot before and after merging GSE133054 and GSE141910. (C) Volcano plot of 455 DEGs. (D) The number of DEGs filtered using limma according to the cutoff criteria [adjusted P value < 0.05, |log2 FC| ≥ 1]. (E) Heatmap of all DEGs.](/cms/asset/c58c052c-976a-4e4d-ae27-3d077b8e4272/dpgp_a_12177958_f0001_c.jpg)
Figure 2 Enrichment analyses of DEGs. (A) GO enrichment analysis of DEGs. (B) KEGG pathway enrichment analysis of DEGs.
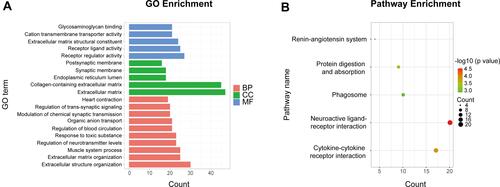
Figure 3 Construction of a coexpression network. (A) Sample clustering to detect outliers; N14, N18, N29, H18, H22, H33, H35, and H36 were excluded. (B) Analysis of the scale-free fit index for various soft-threshold powers; the red line was set at 0.90. (C) Analysis of mean connectivity for various soft-threshold powers. (D) Cluster dendrogram of genes in the coexpression network.
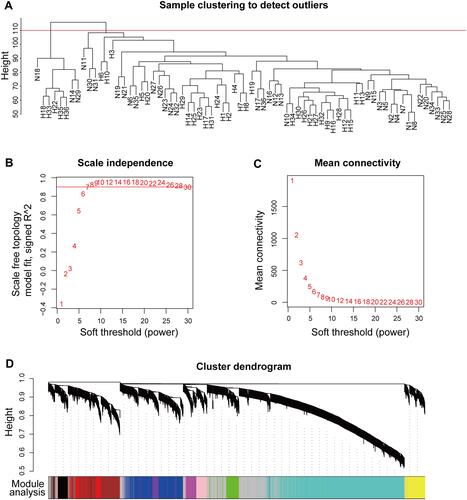
Figure 4 Identification of key modules. (A) Module-trait relationships in the constructed network. (B and C) MM versus GS plot of the key modules. (D and E) Gene expression profiles of the key modules.
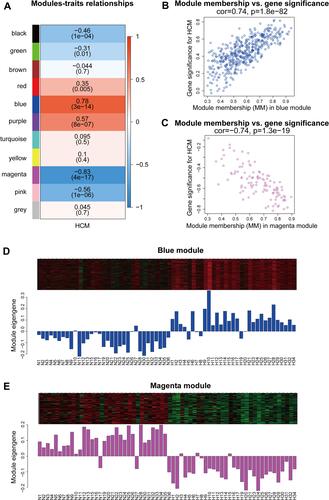
Figure 5 Functional enrichment analysis of the blue modules and identification of hub genes. (A) GO enrichment analysis of the blue module. (B) KEGG pathway enrichment analysis of the blue module. (C) Interaction network of the hub genes in the blue module; red nodes represent the hub genes; green nodes represent other related genes in the module.
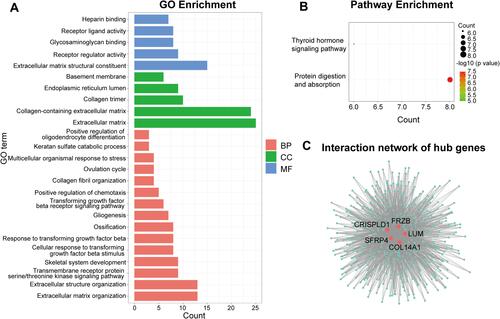
Figure 6 Analysis of the disease-predicting abilities of hub genes. (A) ROC curve analysis of hub genes in the merged dataset. (B) ROC curve analysis of hub genes in the verification dataset GSE36961.
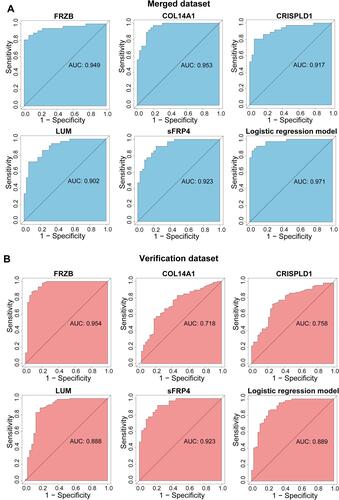
Figure 7 Validation of the expression of hub genes. (A) Expression of hub genes in the merged dataset. (B) Expression of hub genes in the verification dataset GSE36961. (C) Masson’s trichrome staining of mouse hearts. (D) Expression of hub genes in TAC mice. Error bars indicate mean ± standard deviation. **P < 0.01; ***P < 0.001; ****P < 0.0001.
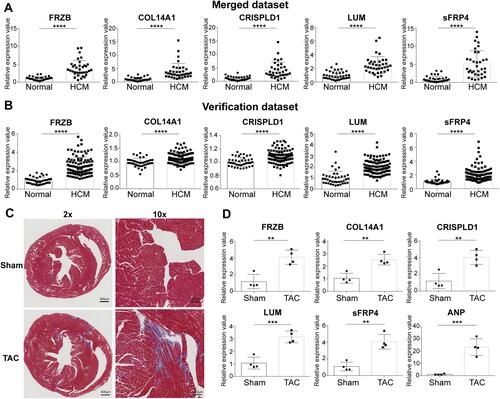
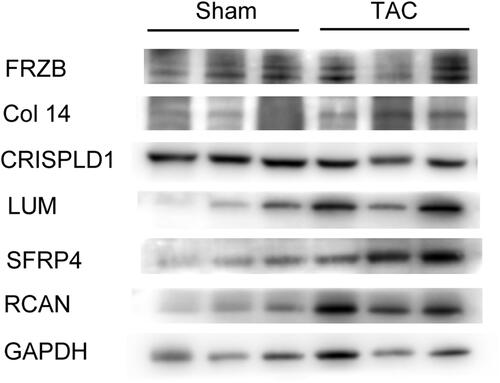
Figure 8 Western blotting tests representing protein levels of hub genes (FRZB, COL14A1, CRISPLD1, LUM, sFRP4) and remodeling gene RCAN in myocardium of sham and TAC mice.