
Figures & data
Table 1 Baseline Characteristics of Patients
Figure 1 Study design.
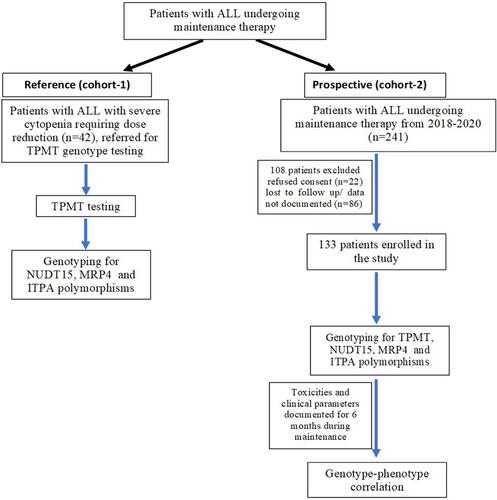
Figure 2 Associations between NUDT15 c.415C>T polymorphism (rs116855232) and % 6-MP dose intensity (A) and therapy interruption (B) in cohort-1 and cohort-2 (C) and (D). *Asterisks indicate the level of the significance (p-value); *Means p< 0.05, **Means p< 0.01, ***Means p< 0.001 and ns-not significant.
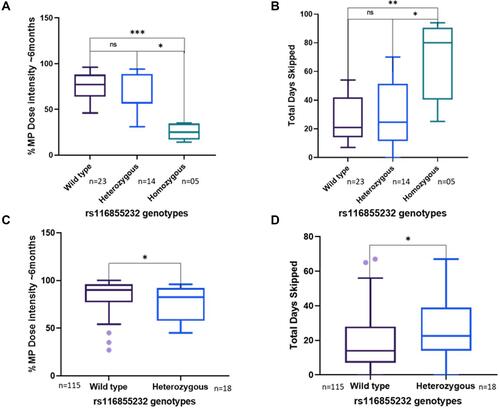
Table 2 Association Analysis of Genetic Variants and Clinical Response in Prospective Patients with ALL Undergoing Maintenance Therapy
Figure 3 Associations between NUDT15 c.415C>T polymorphism (rs116855232) and (A) Early, (B) Late Myelotoxicity. *Asterisks indicate the level of the significance (p-value); *Means p< 0.05 and ****Means p<0.0001.
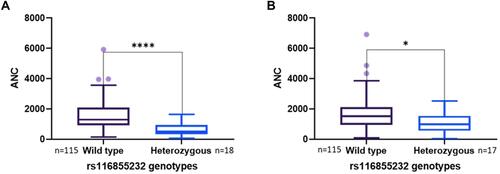
Table 3 Influence of NUDT15 c.415C>T Polymorphism in Early 6-MP Induced Toxicities (Cohort-2)