135
Views
1
CrossRef citations to date
0
Altmetric
Original Research

Gephyrin and CYP2C9 Genetic Polymorphisms in Patients with Pharmacoresistant Epilepsy

, , , ORCID Icon, ORCID Icon, , , & ORCID Icon show all
Pages 1133-1140 | Published online: 09 Sep 2021

Figures & data

Figure 1 Allelic discrimination plots for rs928553 (A) where blue dots represent wild homozygous genotype (TT), and green dots represent mutant heterozygous genotype (TC) and the red dots represent mutant homozygous genotype (CC), and rs1278237 (B) where blue dots represent wild homozygous genotype (GG), and green dots represent mutant heterozygous genotype (GA); amplification plots for both rs928553 and rs1278237 (C), using real time-PCR.

Figure 1 Allelic discrimination plots for rs928553 (A) where blue dots represent wild homozygous genotype (TT), and green dots represent mutant heterozygous genotype (TC) and the red dots represent mutant homozygous genotype (CC), and rs1278237 (B) where blue dots represent wild homozygous genotype (GG), and green dots represent mutant heterozygous genotype (GA); amplification plots for both rs928553 and rs1278237 (C), using real time-PCR.

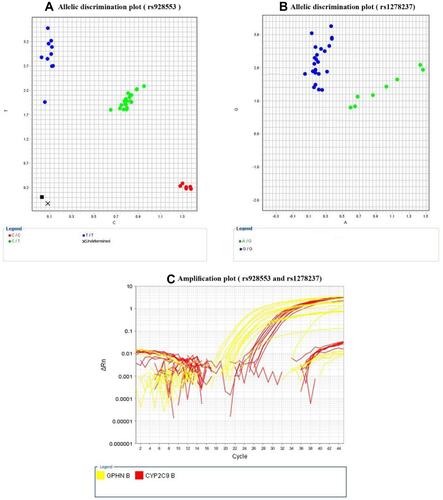
Table 1 Clinical Characteristics of PRE Patients

Table 2 Genotypes and Alleles Frequencies of GPHN T>C in the Study Groups

Table 3 Genotypes and Alleles Frequencies of CYP2C9 G>A in the Study Groups