Figures & data
Figure 1 Expression profiles of KIF23 in pan-cancer. (A) KIF23 expression in pan-cancers and adjacent normal tissues in the Oncomine database. (B) KIF23 expression between tumor samples from TCGA database and normal samples from GTEx database (*P < 0.05, **P < 0.01, ***P < 0.001).
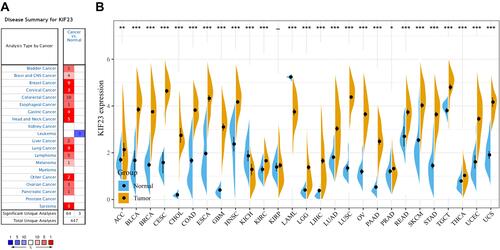
Figure 2 Correlation of KIF23 expression with OS for pan-cancer in TCGA. (A) Forest plot of the relationship between KIF23 and OS in various cancers. (B–M) Kaplan-Meier analysis of OS with significance in twelve cancer types (ACC, BLCA, KICH, KIRC, KIRP, LGG, LIHC, LUAD, MESO, PAAD, PRAD and THYM).
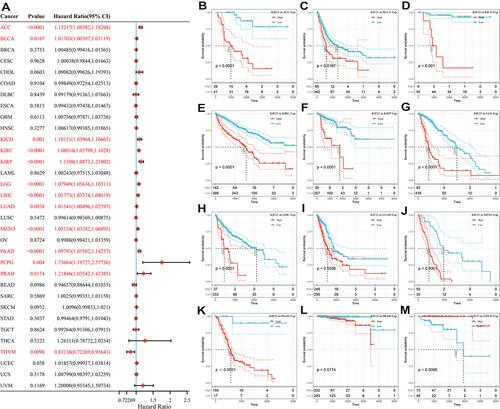
Figure 3 Association between KIF23 expression and tumor grade (A), stage (B) and immune subtypes (C) in KIRC.
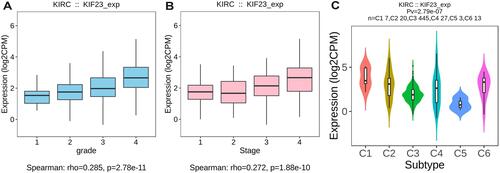
Figure 4 KIF23 mutation landscape. (A) KIF23 gene alteration types and frequency in pan-cancer. (B) The 3D structure of KIF23 protein. (C) Diagram of protein domain mutations of KIF23 in different types of cancer. (D) Survival analysis for OS, DFS and PFS in patients with genetic alterations.
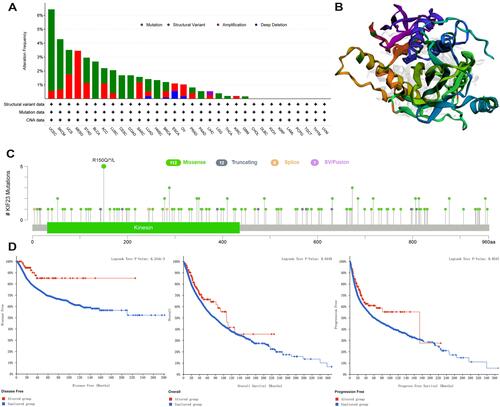
Figure 5 Correlation of KIF23 expression with estimate score (A), immune score (B) and stromal score (C) in KIRC.
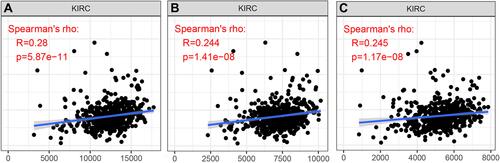
Figure 6 Common genes between KIF23-related genes (KRGs) and ferroptosis-related genes (FRGs).
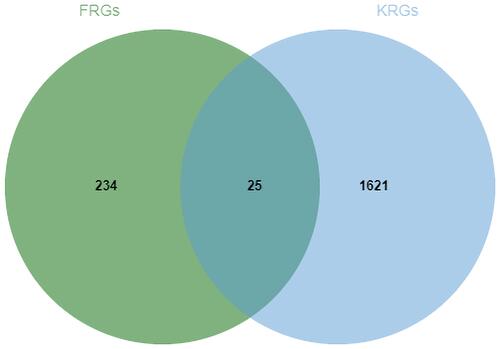
Figure 7 Construction of risk score model for ccRCC. (A) Lasso coefficient profiles of nine genes in ccRCC. (B) Partial likelihood deviance versus log (λ) was drawn using LASSO Cox regression model. (C) Risk score, survival time, and survival status in TCGA dataset. The above represents a scatter plot of this risk score from low to high; The middle represents the corresponding survival time and survival status scatter plot distributions of different samples risk score; The bottom most plot represents the expression heatmap of the genes in this signature. (D) Survival curves for OS in high - and low-risk groups. (E) The ROC curves for risk score model.
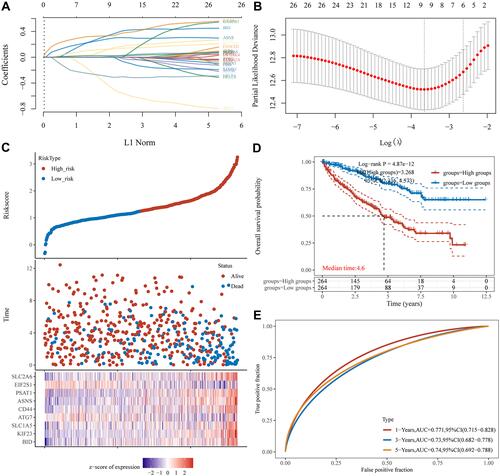
Figure 8 Univariate Cox analysis for the independent prognostic factors for ccRCC.
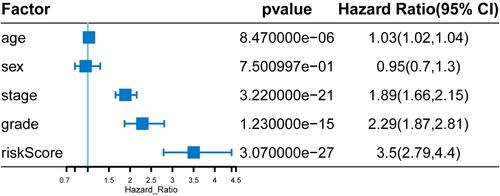
Figure 9 Construction and validation of nomogram model for ccRCC. (A) The nomograph model to predict 1-, 3-, and 5-year survival for ccRCC. (B) DCA curves showing the net benefit of 1-, 3-, 5-year prediction model. (C) The Calibration curve for assessment of the overall survival nomogram based on TCGA database. (D) Patients from GSE29609 were classified into high- and low-risk groups by the risk score model. Kaplan Meier analysis was applied to compare OS between the two groups. (E) The Calibration curve for assessment of the overall survival nomogram based on GSE29609 data.
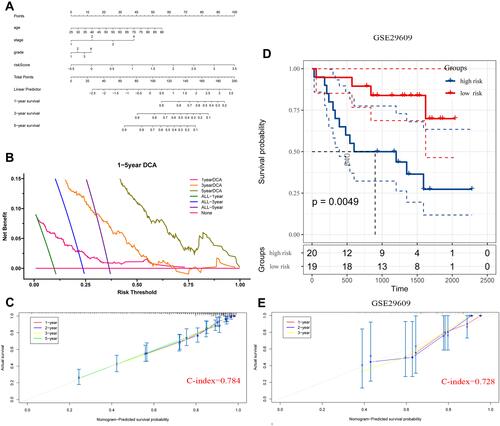
Figure 10 Gene set enrichment analysis. (A) KEGG pathway analysis of KIF23 in ccRCC. (B–E) GO functional annotation of KIF23 in ccRCC.
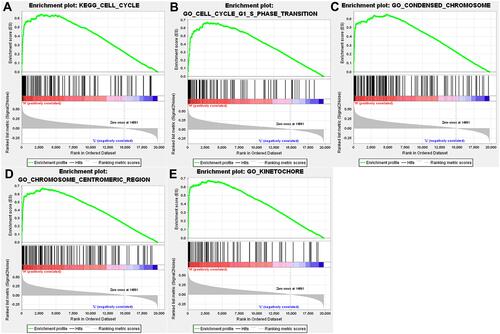
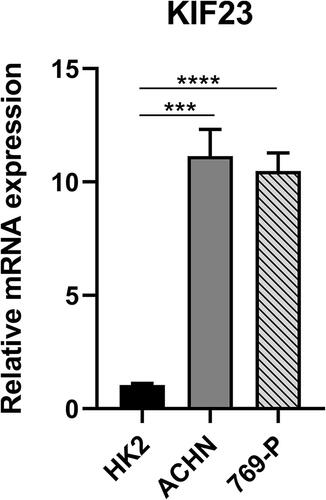
Figure 11 Validation of KIF23 mRNA expression in ccRCC and normal cell lines (***P < 0.0001, ****P < 0.00001).