Figures & data
Table 1 Characterization of 47,265 PGx Testing
Figure 1 Age distribution of 47,265 pharmacogenetic testing results. Age distribution in (A) kernel density estimation and (B) histogram.
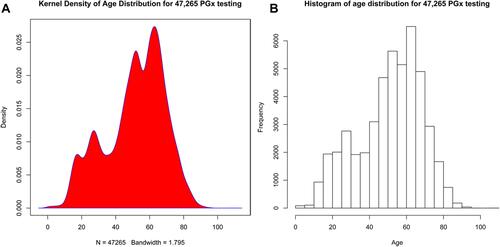
Table 2 The Detection Rate of PGx Testing in the Inpatient Departments
Figure 2 Departments distribution of 47,265 pharmacogenetic testing from 2013 to 2018.
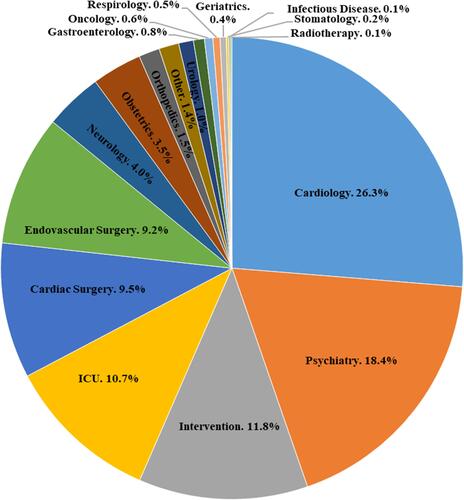
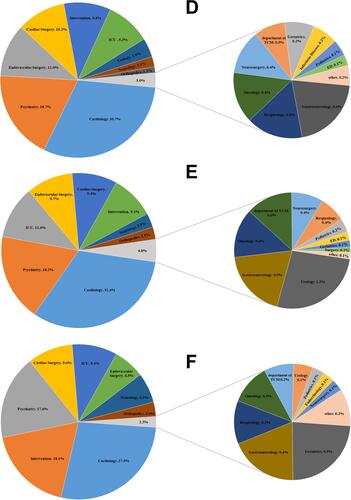
Figure 3 Continue.
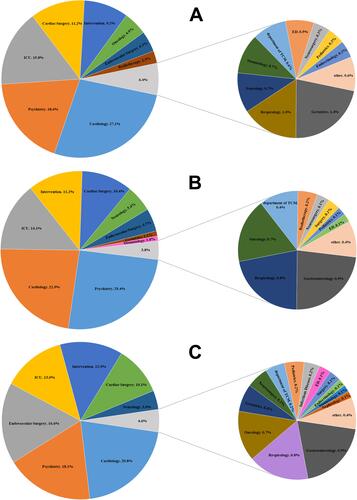
Figure 3 Departments distribution of annual pharmacogenetic testing results from 2013 to 2018. (A) 2013, (B) 2014, (C) 2015, (D) 2016, (E) 2017, (F) 2018.