
Figures & data
Table 1 Demographic and Clinical Profile of the Bisoprolol Pharmacokinetics Cohort
Table 2 Pharmacokinetic Population Parameters of the Final Model
Table 3 SNPs That Reached Genome-Wide Significance (p value < 5×10⁻⁸) for Bisoprolol Clearance in PhACS Patients
Figure 1 Manhattan plot of bisoprolol clearance in patients with acute coronary syndrome. The red line represents the genome-wide significance p value threshold (5x10⁻⁸) and blue lines represents the nominal significance threshold (1x10⁻⁵).
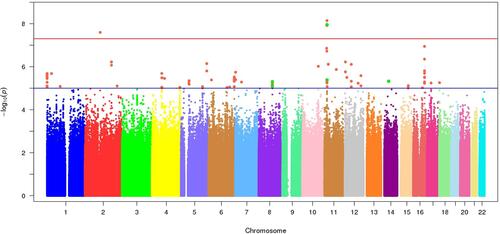
Figure 2 Regional association plot for bisoprolol clearance at the CCDC34 locus (A), LONRF2 (B), CYP2D6 (C), and CYP3A (D). The colours reflect linkage disequilibrium (r2) for the signals with the lowest p values.
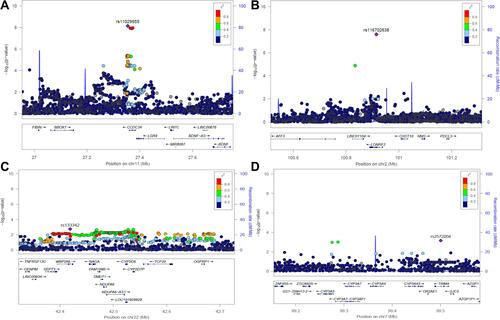
Table 4 Associations Between Office and 24-Hour Ambulatory Changes in Heart Rate and the Identified Bisoprolol GWAS-Significant SNPs in GENRES Patients