Figures & data
Figure 1 Power estimates for the PGx discovery stage for all scenarios.
Notes: Power estimates of VC-RBAT and SS-RBAT to detect ABCA1 and the power of SSAT to detect the subgroup-defining SNPs in the discovery trial using alpha-level α1 are shown for all scenarios considered in this POC study. Scenario 1 (A and B): Enhanced treatment effect is driven by a single SNP located in an LD block. Scenario 2 (C and D): Enhanced treatment effect is driven by a single SNP not in LD with other SNPs. Scenario 3 (E and F): Enhanced treatment effect is driven by two SNPs located in the same gene (but in different LD blocks).
Abbreviations: VC-RBAT, variance components region-based association testing; SS-RBAT, single single-nucleotide polymorphism region-based association testing; SSAT, single single-nucleotide association testing; PGx, pharmacogenomics; SNPs, single-nucleotide polymorphisms; POC, proof-of-concept; LD, linkage disequilibrium.
Abbreviations: VC-RBAT, variance components region-based association testing; SS-RBAT, single single-nucleotide polymorphism region-based association testing; SSAT, single single-nucleotide association testing; PGx, pharmacogenomics; SNPs, single-nucleotide polymorphisms; POC, proof-of-concept; LD, linkage disequilibrium.
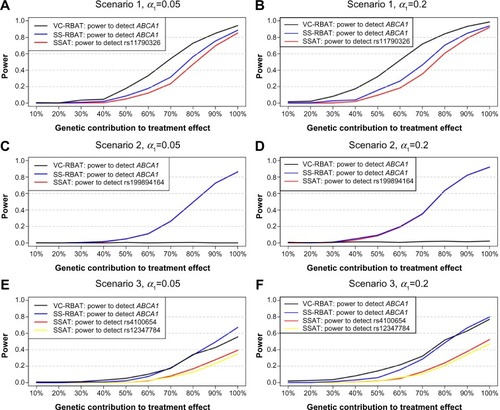
Figure 2 Power estimates for the replication of PGx effects for selected scenarios.
Notes: Power estimates to discover and replicate (ie, performance metrics 3 and 4) for a targeted scenario where the genetic contribution to the treatment effect is 60%. Power was calculated as the proportion among the 500 dataset pairs where the unit of interest (ie, the SNP or gene) was significant after multiplicity adjustment in the discovery trial using alpha-level α1 (ie, 0.05 in A and 0.2 in B) and significant after multiplicity adjustment in the replication trial using alpha-level α2 (ie, 0.05 in A and B). Similar observations were made across the entire range of genetic contributions.
Abbreviations: VC-RBAT, variance components region-based association testing; SS-RBAT, single single-nucleotide polymorphism region-based association testing; SSAT, single single-nucleotide association testing; SNP, single-nucleotide polymorphism; PGx, pharmacogenomics.
Abbreviations: VC-RBAT, variance components region-based association testing; SS-RBAT, single single-nucleotide polymorphism region-based association testing; SSAT, single single-nucleotide association testing; SNP, single-nucleotide polymorphism; PGx, pharmacogenomics.
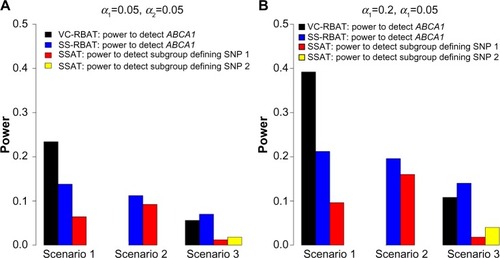
Table 1 Type 1 error in the PGx discovery stage
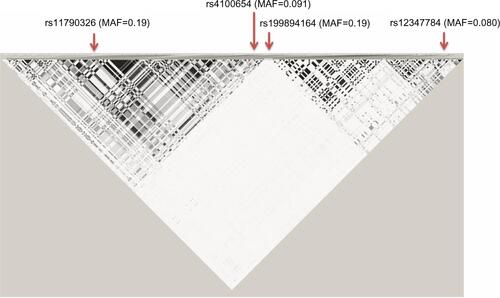
Figure S1 Linkage disequilibrium plot of ABCA1 region used for simulation studies.
Abbreviation: MAF, minor allele frequency.