
Figures & data
Table 1 Demographic data of 138 patients who underwent pharmacokinetic study
Figure 1 (A) Comparison of AUC decile distribution between patients who carried TC alleles (dark bars) and patients who carried TT alleles (light bars) in UGT2B7 at position 268. (B) Comparison of allele frequency between the group with AUC above 30 mg-h/L (left pie chart) and the group with AUC below 30 mg-h/L (right pie chart).
Abbreviation: AUC, area under the curve.
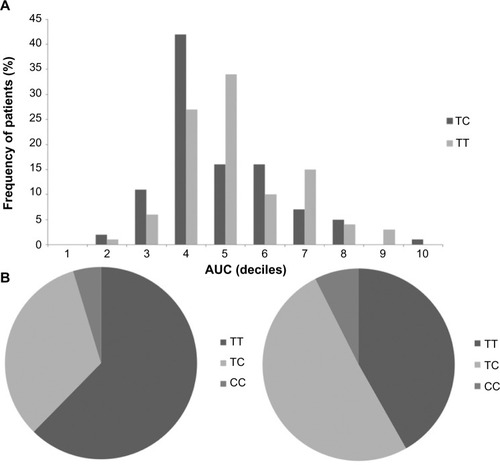
Table 2 Test for association between polymorphisms and AUC