Figures & data
Table 1 Description of Sociodemographic Data (n = 499)
Table 2 Table of Original and Adapted Items
Table 3 Factorial Weights for Each Estimated Model of the MOS (n = 499)
Table 4 Fit Indices of Factor Models and Invariance of the MOS Scale
Figure 1 Network analysis of social support, quality of life measure and gender.
Note: The blue lines represent positive relationships, and the red lines are negative associations.
Abbreviations: GND, gender (male=1, female=2); QOL, quality of life; ES, emotional support; TS, tangible support; PI, positive interactions; AS, affective support.
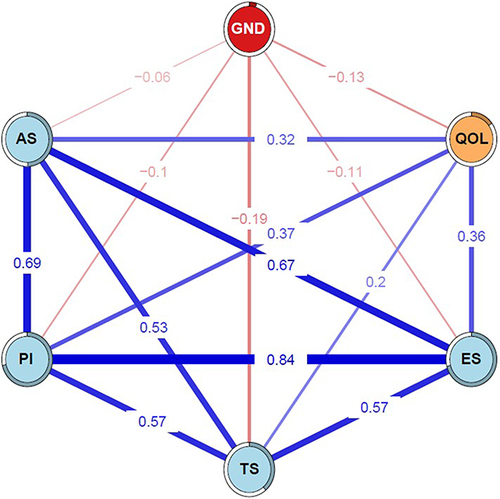
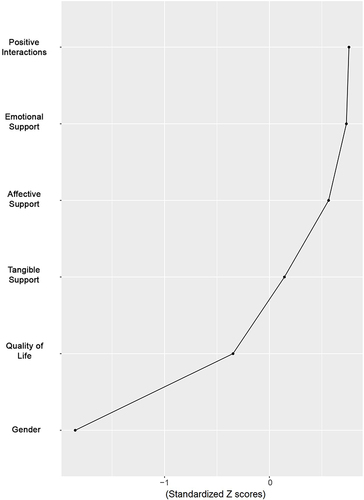
Figure 2 Expected influence of social support dimensions, quality of life measures and gender.
Note: The closer to the value of 1, the more influence it has on other variables in the network.