
Figures & data
Table 1 Demographics of the Study Participants
Figure 1 The impact of CHB on life. A larger percentage represents more participants felt affected.
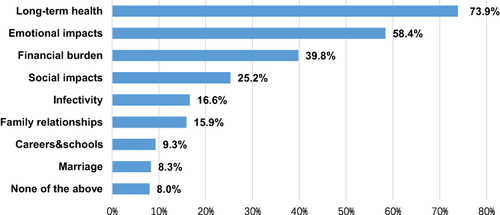
Figure 2 (a) Satisfaction reasons of current treatment. A larger percentage represents more participants felt satisfied. (b) Dissatisfaction reasons of current treatment. A larger percentage represents more participants felt dissatisfied.
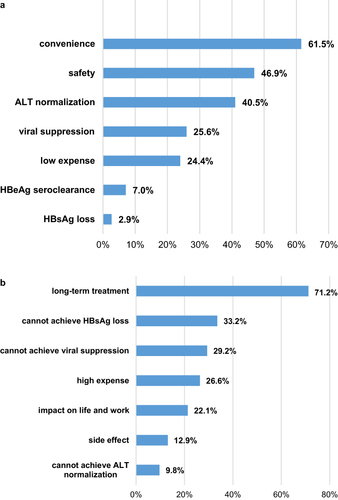
Table 2 Association Between Functional Cure Awareness and Patient Characteristics
Table 3 Association Between Willingness to Participate in HBV Functional Cure Related Clinical Trials and Patient Characteristics