Figures & data
Figure 1 Study design and sample size.
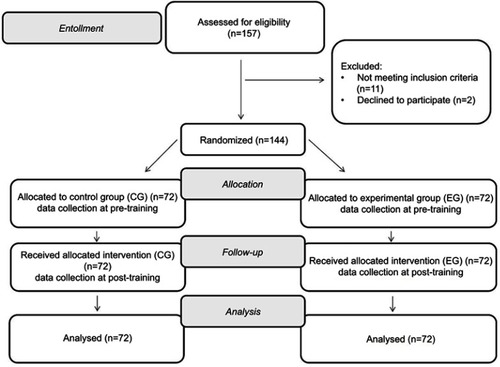
Table 1 Baseline demographic characteristics for each group
Figure 2 Balanced Emotional Empathy Scale mean scores in the experimental and control groups at T0 and T1.
Abbreviations: BEES EG, Balanced Emotional Empathy Scale Experimental group; BEES CG, Balanced Emotional Empathy Scale Control group; T0, Before training intervention; T1, After training intervention.
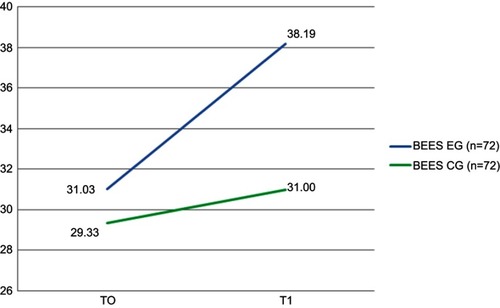
Table 2 BEES mean scores in the EG and CG, at T0 and T1
Figure 3 Jefferson Scale of Empathy — Health Profession Student mean scores in the experimental and control groups at T0 and T1.
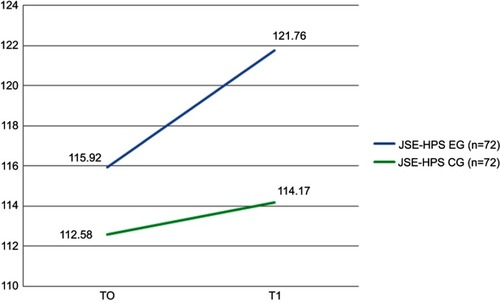
Table 3 JSE-HPS mean scores in the EG and CG, at T0 and T1
Table 4 Mean scores of JSE-HPS subscales in the EG and CG, at T0 and T1
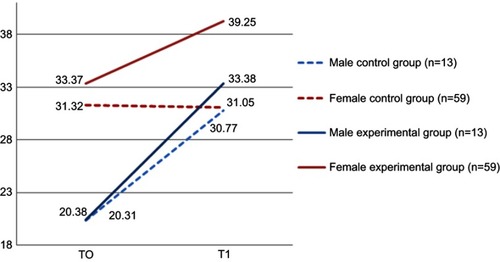
Figure 4 Mean Balanced Emotional Empathy Scale scores in the experimental and control groups, divided by sex.