
Figures & data
Figure 1 A single trial of the experimental procedure. Participants were instructed to report their purchase intention toward four kinds of aquatic products (fresh-static, fresh-dynamic, frozen-static and frozen-dynamic) on a 5-point scale. Electroencephalograms (EEGs) were recorded from the subjects throughout the experiment.
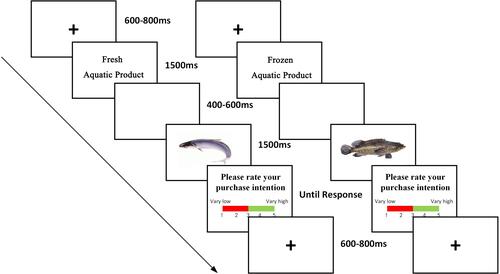
Figure 2 Behavioral results. Purchasing intention of four conditions (fresh-static, fresh-dynamic, frozen-static and frozen-dynamic).***p< 0.001.
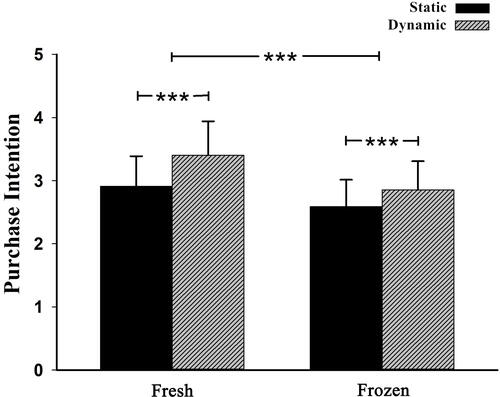
Figure 3 N2 results. (A) Grand-averaged ERP waveforms at channel FCz for four conditions (fresh-static, fresh-dynamic, frozen-static and frozen-dynamic). Shaded areas indicate the time window of the N2 (220–320 ms) used for statistical analysis. (B) The N2 latency comparison among four conditions.*p< 0.05.
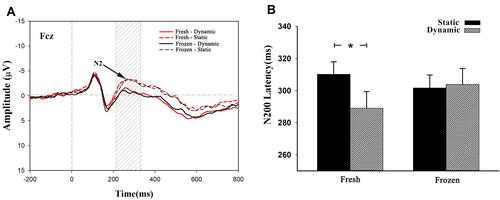
Figure 4 LPP results. (A) Grand-averaged ERP waveforms at channel CPz for four conditions (fresh-static, fresh-dynamic, frozen-static and frozen-dynamic). Shaded areas indicate the time window of the LPP (520–620 ms) used for statistical analysis. (B) The LPP latency comparison between static and dynamic product conditions. **p< 0.01.
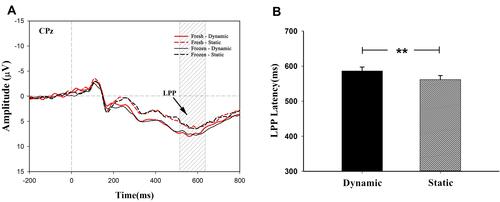
Table 1 The Results of Behavioral and ERPs