Figures & data
Figure 1 A depiction of the RI-CLPM including the relationships between cognitive function, depressive symptoms, and sleep quality across the three waves. W represents within-person variable; T1 represents 2008; T2 represents 2011; T3 represents 2014; T4 represents 2018. The observed variables are represented in the squares. Of these observed variables, latent variables at both the between and within level were constructed. These latent variables are displayed as ovals. The three random intercepts (RI Cognitive Function, RI Depressive Symptoms, and RI Sleep Quality) reflect the between-person variances. The nine latent within-person variables (WT1-WT4 Cognitive Function, WT1-WT4 Depressive Symptoms, and WT1-WT4 Sleep Quality) reflect the within-person variances across 4 waves. The within-person paths are illustrated by the modeling structure between the nine latent within-person variables: 3 autoregressive paths between the latent factors of Within Cognitive Function, 3 autoregressive paths between the latent factors of Within Depressive Symptoms, and 3 autoregressive paths between the latent factors of Within Sleep Quality; 3 cross-lagged paths from the latent factors of Within Cognitive Function to Within Depressive Symptoms and 3 cross-lagged paths from the latent factors of within Depressive Symptoms to Within Cognitive Function; 3 cross-lagged paths from the latent factors of Within Cognitive Function to Within Sleep Quality and 3 cross-lagged paths from the latent factors of Within Sleep Quality to Within Cognitive Function; 3 cross-lagged paths from the latent factors of Within Depressive Symptoms to Within Sleep Quality and 3 cross-lagged paths from the latent factors of Within Sleep Quality to Within Depressive Symptoms; correlations between Within Cognitive Function, Within Depressive Symptoms, and Within Sleep Quality at Wave 1, and between the residual correlations of Within Cognitive Function, Within Depressive Symptoms, and W Sleep Quality at Waves 2 and 3.
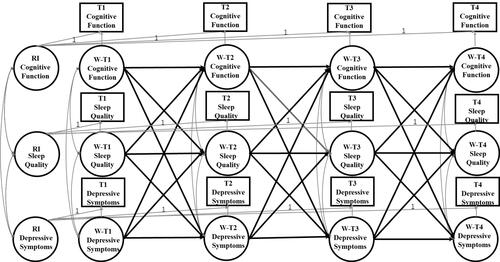
Table 1 Fit Indices of Structured Equation Models for Cross-Lagged Panel and Mediation Analysis
Table 2 Sample Characteristics of Depressive Symptoms, Cognition (MMSE Score), Sleep Quality and Covariates
Table 3 Correlations Between Latent Variables of Depressive Symptoms and Cognitive Function and a Manifest Variable of Sleep Quality
Figure 2 Latent variable cross-lagged panel model of the reciprocal relationship between depressive symptoms and cognitive function. Parcels of cognitive function, overtime correlations between parcel-specific residuals, fixed residual variances of depressive symptoms and control variables are not shown to enhance clarity. Unstandardized regression coefficients are presented. ***p < 0.001, **p < 0.01.
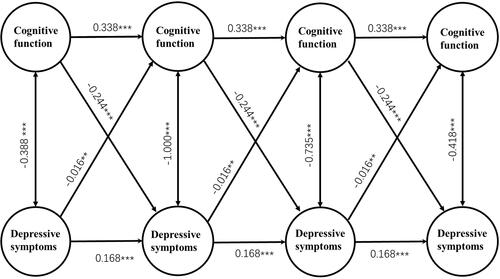
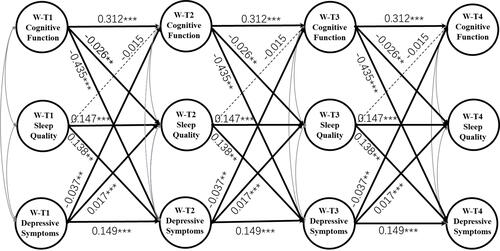
Figure 3 Mediating effects of Within Sleep Quality on the reciprocal relationship between Within Depressive Symptoms and Within Cognitive Function. W-T1 represents within-person variable in 2008; W-T2 represents within-person variable in 2011; W-T3 represents within-person variable in 2014; W-T4 represents within-person variable in 2018. Correlations among the three variables on each occasion and control variables are not shown to enhance clarity. Unstandardized regression coefficients are presented. ***p < 0.001, **p < 0.01.