Figures & data
Figure 1 The implementation process of Sharing Reward Program (the dotted line indicates that the process may not occur).
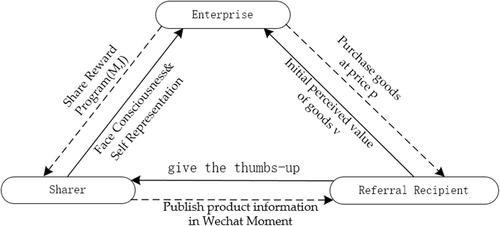
Table 1 Basic Symbols and Parameter Description
Figure 2 In the case of low price, the amount of reward varies with face consciousness.
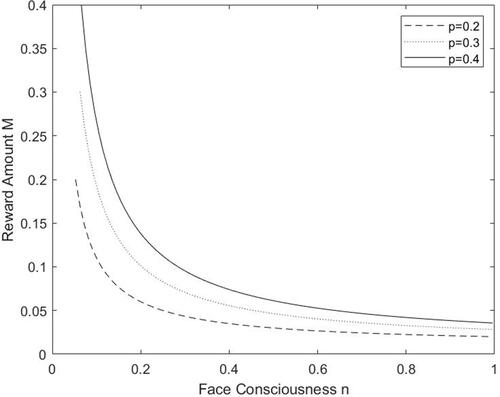
Figure 3 In the case of high price, the amount of reward varies with face consciousness.
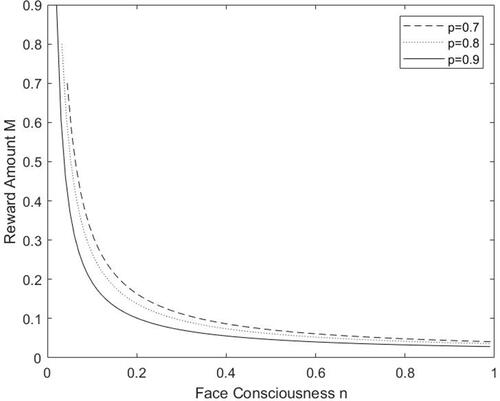
Figure 4 The variation trend of reward amount with price under different face consciousness.
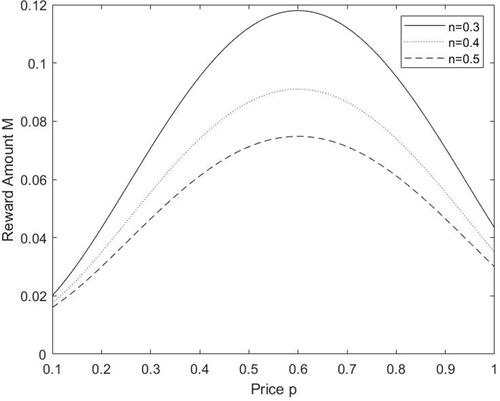
Figure 5 The variation trend of profit with price under different face consciousness.
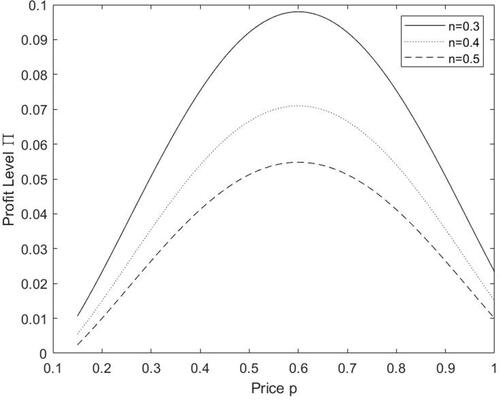
Table 2 The Comparative Result of the Optimal Reward Structure and the Enterprise’s Expected Profit Level Between Theorem 2-1 Strategy and the Actual Strategy
Figure 6 Distribution map of the ratio of likes to Awards.
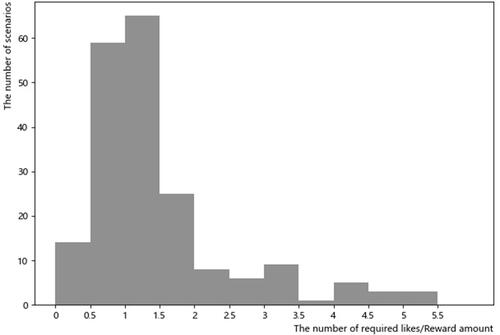
Figure 7 The profit level comparison between Theorem 2-1 strategy and actual strategy.
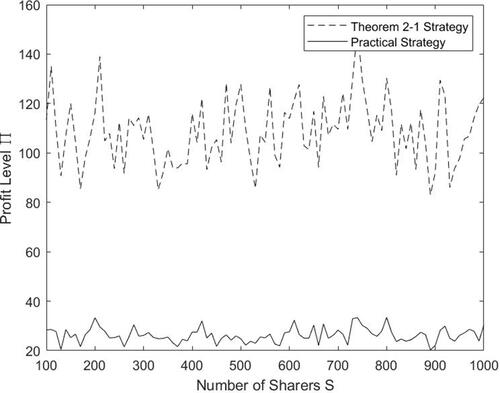
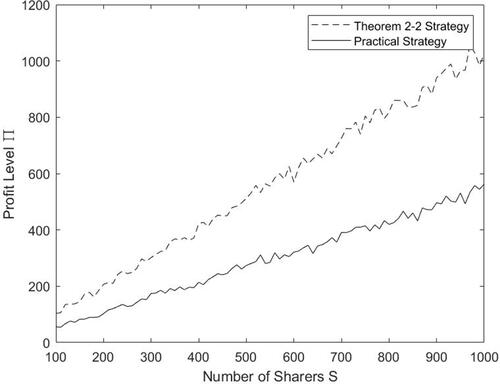
Table 3 The Comparative Result of the Optimal Reward Structure and the Enterprise’s Expected Profit Level Between Theorem2-2 Strategy and the Actual Strategy
Figure 8 The comparison of the profit level between Theorem 2-2 strategy and the actual strategy.