Figures & data
Figure 1 The proposed moderated mediation model.
Note: Each line or path in the model is represented by a lowercase letter, which represents the path coefficient.
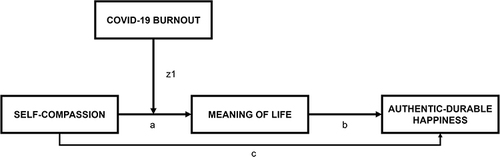
Table 1 Descriptive Statistics and Bivariate Correlations of Study Variables
Table 2 Regression Analyses for Each Path of the Conceptual Model
Figure 2 Moderated mediation model.
Notes: Dotted lines represent direct paths from the moderators to the mediator and outcome variables. Standardized beta coefficients are presented; total effect is presented in the parentheses. ***p < 0.001.
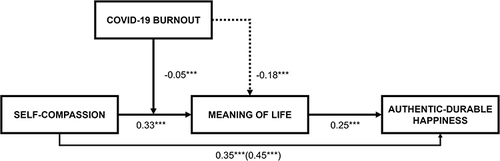
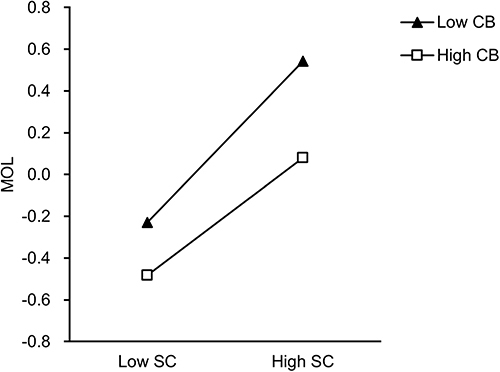
Figure 3 Interaction between SC and CB on MOL.
Note: SC and CB were graphed as one standardized deviation below the sample mean (ie, low) and one standardized deviation above the sample mean (ie, high).