
Figures & data
Table 1 Reliability and Convergence Validity Scale
Table 2 Results of Confirmatory Factor Analysis
Table 3 Mean, Standard Deviation, and Correlation Coefficient of Variables (N=340)
Figure 1 Multi-path model diagram of coaching leadership and employee deviant innovation behavior.
Note: **denotes p<0.01.
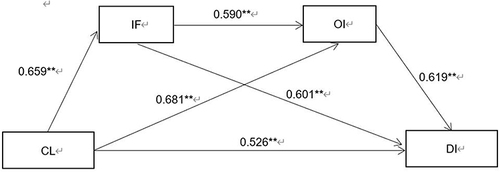
Table 4 Bootstrap Test of Significance of Main Effect Values