Figures & data
Figure 1 Conceptual framework.
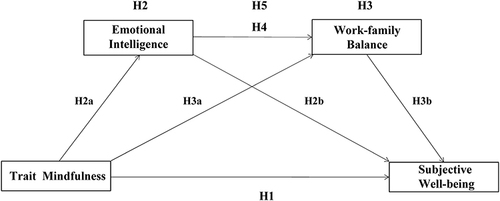
Table 1 Social Demographic Features of Participants (N = 321)
Table 2 Means, Standard Deviations, and Correlations of the Major Study Variables
Table 3 Fit Indices of the Model
Table 4 The Direct Effect of the Research Paths and Research Model Hypothesis Analysis
Table 5 The Indirect Effect of the Research Paths
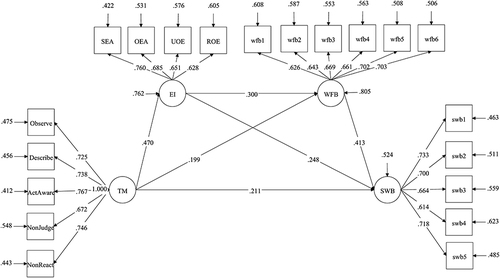
Figure 2 Structural equation model.
Abbreviations: TM, trait mindfulness; SWB, subjective well-being; EI, emotional intelligence; WFB, work–family Balance; SEA, self-emotion appraisal; OEA, others’ emotion appraisal; UOE, use of emotion; ROE, regulation of emotion.