Figures & data
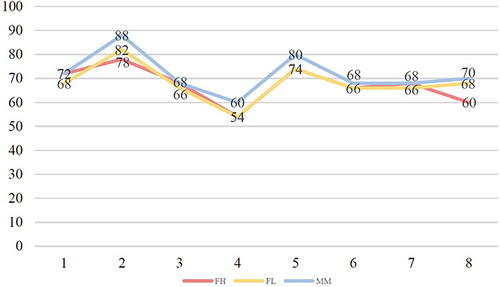
Figure 1 The performance of the three students FH FL MM.
Note: High, medium gray and black with black borders; Medium, white and medium gray with black borders; Low, white and light gray with black borders.
Abbreviations: M, Mathematics self-efficacy; O, Openness level; B, Basic knowledge; A, Mathematics achievement; C, Class participation in discussion; R, Review habit; E, Enthusiasm for math; S, Speed of solving problems; P, Problem-solving error rate; L, learning strategies; W, Willpower; Y, Yes; N, No.
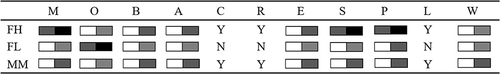
Table 1 The Specific Fields in Mathematics Problems During 8 Interventions
Figure 2 Flow chart of the study procedure.
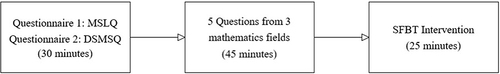
Figure 3 (A) Radar chart of three students FH’s mathematics self-efficacy across 8 dimensions. (B) Radar chart of three students FL’s mathematics self-efficacy across 8 dimensions. (C) Radar chart of three students MM’s mathematics self-efficacy across 8 dimensions.
Abbreviations: A, Number and Algebra; B, Graphics and Geometry; C, Synthesis and Practice; D, Lack of interest in and fear of mathematics; E, Relative competence in mathematics; F, Self-confidence and competence in mathematics; G, Interest in, effort in, and perception of the importance of mathematics; H, Mathematics anxiety.
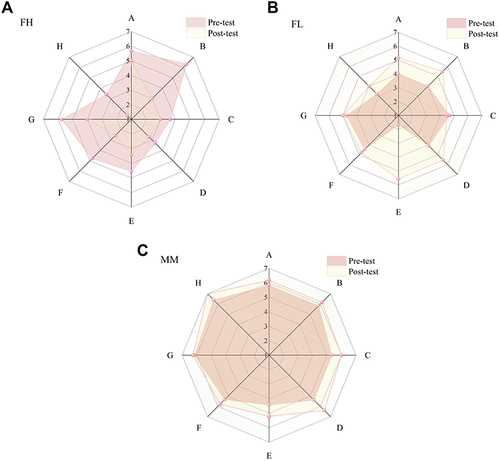
Figure 4 Wright Map of 62 items during 8 interventions.
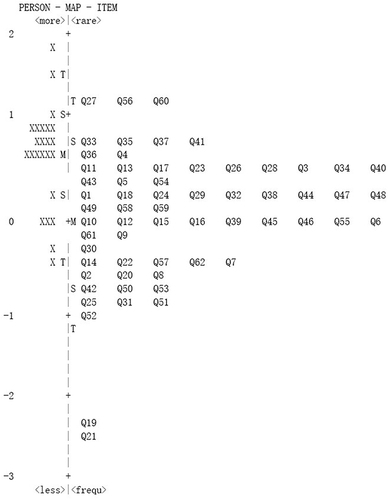
Figure 5 Wright Map for 3 students FH FL MM during 8 interventions.
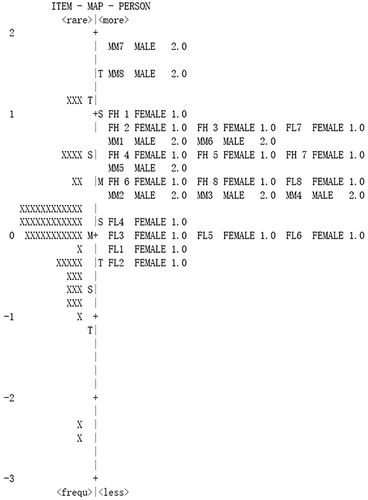
Table 2 Average Scores of Mathematics Self-Efficacy for Three Students FH FL MM per Session
Figure 6 Average score of mathematics self-efficacy for students FH FL MM per session.