Figures & data
Table 1 Prevalence of Each ACE and ACE Scores in the Study 1 and Study 2
Table 2 The Proportions of Utilitarian Choices in Each Dilemma Made by the No, Low, and High- ACE Groups
Table 3 Means and 95% Confidence Intervals of Action Responses to the Four Types of Moral Dilemmas Among the No, Low, and High-ACE Groups
Table 4 Means and 95% Confidence Intervals of C, N, and I Parameters Among the No, Low, and High-ACE Groups
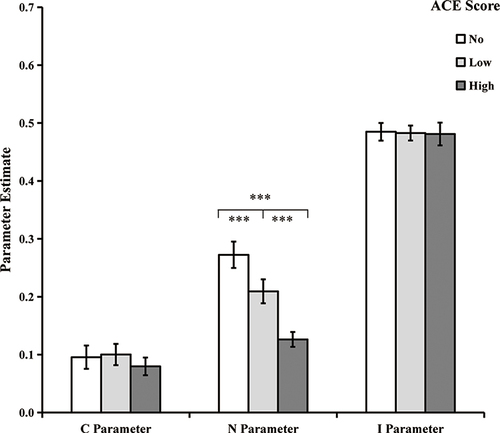
Figure 1 Parameter estimates of sensitivity to consequences (C), sensitivity to norms (N), and general preference for inaction versus action (I) among the no, low, and high-ACE groups. Error bars depict 95% confidence intervals. ***p < 0.001.