
Figures & data
Figure 1 Flow chart of the sampling process.
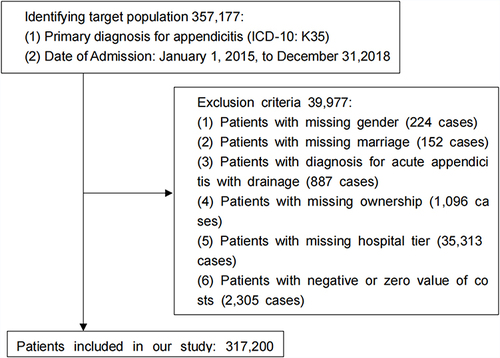
Table 1 Descriptive Statistics of Inpatients with Acute Appendicitis from 2015 to 2018
Table 2 Components of Hospitalization Costs (RMB)
Table 3 Regression Results
Figure 2 The time trend of key factors on the total hospitalization costs.
Notes: The figures show the time trend of key factors on the total hospitalization costs. The dot represents regression coefficients, and the solid lines represent 90% confidence intervals. The regression coefficients refer to the interaction terms of key factors and years, where 2015 is the baseline year. All regressions control for city fixed effects and year fixed effects except for the control variables in Equation (1). (A and B) plot the results of laparoscopic surgery versus open surgery and no surgery, while (C) plots those of open surgery versus no surgery. (D) plots the results for tier II hospitals compared to PHCs, while (E) plots those for tier III hospitals compared to tier II hospitals. (F) plots the results for public hospitals in comparison to private. (G) plots the regression results for those aged 65+ compared to those aged 18–65. (H) plots the regression results of the interaction terms for number of patient complications and year.
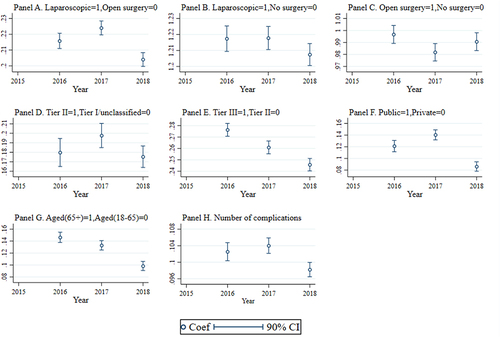
Table 4 The Difference of AMA Across Hospital Tier and Hospital Ownership