
Figures & data
Figure 1 Gestational age impacts risk for severe hyperbilirubinemia.
Notes: Risk of developing a total serum bilirubin (TSB) level of 20 mg/dL (342 μmol/L) or higher as a function of gestational age and percentile of the first TSB measured at less than 48 hours on the Bhutani nomogram.Citation22 Copyright © 2005 American Medical Association. All rights reserved. Reproduced from Newman TB, Liljestrand P, Escobar GJ. Combining clinical risk factors with serum bilirubin levels to predict hyperbilirubinemia in newborns. Arch Pediatr Adolesc Med. 2005;159(2):113–119.Citation22
Abbreviation: wk, weeks.
Abbreviation: wk, weeks.
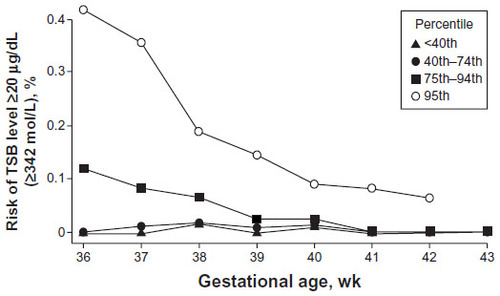
Figure 2 American academy of pediatrics phototherapy guidelines.
Notes: Guidelines for phototherapy in hospitalized infants ≥35 weeks’ gestation. Risk factors are isoimmune hemolytic disease, glucose-6-phosphate dehydrogenase deficiency, asphyxia, significant lethargy, temperature instability, sepsis, acidosis, or an albumin level of less than 3.0 g/dL (if measured). Use total bilirubin. Do not subtract direct-reacting or conjugated bilirubin. Reproduced with permission from Pediatrics, 124, 1193–1198, Copyright © 2009 by the AAP.Citation16
Abbreviation: wk, weeks.
Abbreviation: wk, weeks.
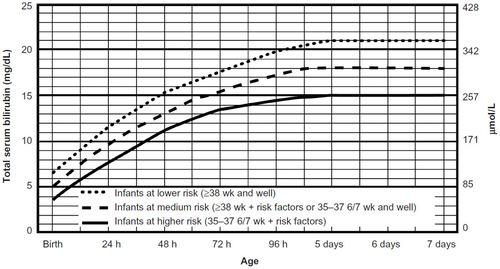
Figure 3 Bf/TBC ratio improves prediction of bilirubin-induced brainstem response abnormalities.
Notes: Receiver-operating characteristics of the total bilirubin concentration (TBC), plasma-unbound or “free” bilirubin concentration (Bf), and the Bf/TBC ratio as predictors of an abnormal automated auditory brainstem response are shown. The straight line is the expected curve (unity) if the variable has no predictive value (are under the curve, 0.5). The areas under the curve are Bf/TBC ratio, 0.83; Bf, 0.69; and TBC, 0.50. The areas under the Bf/TBC and Bf are significantly greater than that under the TBC curve. Reprinted by permission from Macmillan Publishers Ltd: J Perinatol. Ahlfors CE, Amin SB, Parker AE. Unbound bilirubin predicts abnormal automated auditory brainstem response in a diverse newborn population. 2009;29:305–309. Copyright © 2009.Citation43
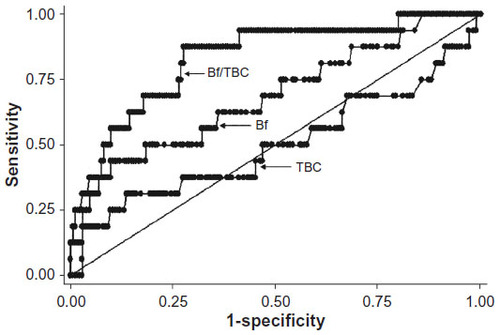
Table 1 Clinical bilirubin-induced neurological dysfunction (BIND) score of onset, severity, and progression of acute bilirubin encephalopathy, as elicited by history and physical examination