Figures & data
Table 1 Primer Sequences for Real-Time Quantitative Polymerase Chain Reaction (RT-qPCR)
Figure 1 Summary of the experimental scheme.
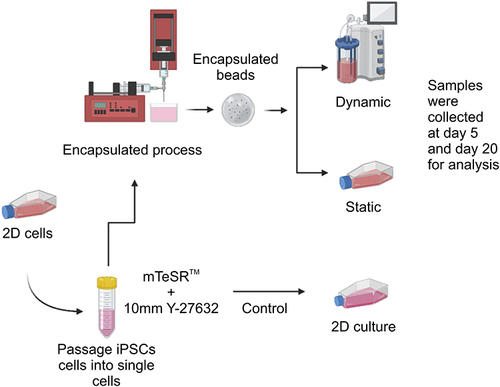
Figure 2 Characterization of human-induced pluripotent stem cells (IPSCs) before and after encapsulation.
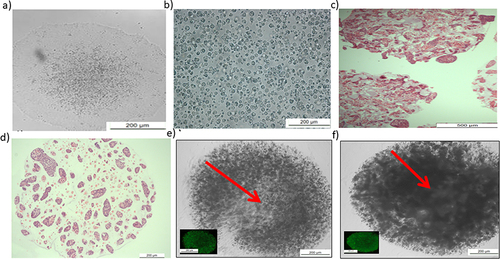
Figure 3 Comparison of proliferation between two-dimensional (2D), static, and dynamic cultures of human induced pluripotent stem cells.
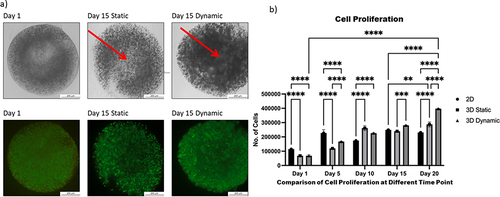
Figure 4 Proliferation of human induced pluripotent stem cells encapsulated within alginate hydrogel red gelatin (3DD G) or alginate hydrogel+ Matrigel™ (3DD M) in 3D dynamic culture.
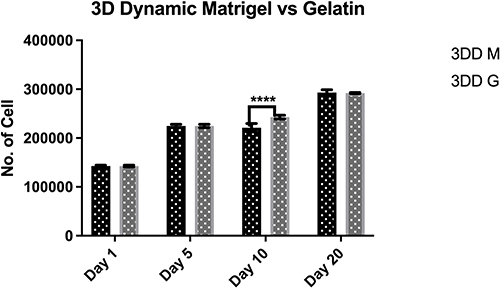
Figure 5 Proliferation of human induced pluripotent stem cells encapsulated within alginate hydrogel + gelatin and cultured with mTeSR™ medium with ROCK inhibitor 3DD (RI) or without ROCK inhibitor 3DD (W/O RI) in dynamic three-dimensional (3D) culture.
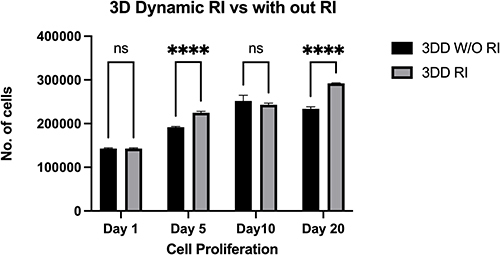
Figure 6 Comparison of the pluripotency and differentiation markers between the static and dynamic conditions.
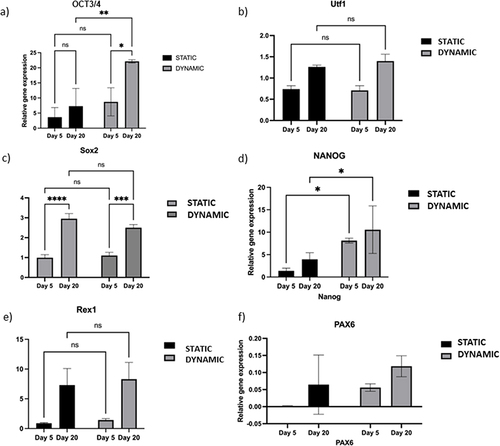
Figure 7 Effect of hypoxia on encapsulated cells during prolonged adaptation under both static and dynamic conditions.
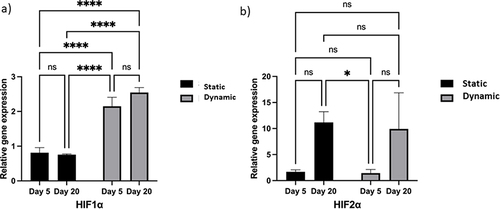
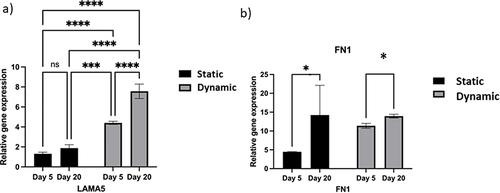
Figure 8 Extracellular matrix (ECM) secretion by human induced pluripotent stem cells (IPSCs) cultured in a three-dimensional (3D) environment.