
Figures & data
Figure 1 (A) Distribution of normal, diploid aneuploidy, polyploidy, loss of heterozygosity and copy number variants of miscarriage villous genetic results. (B) Distribution of single chromosome aneuploidy among the different human chromosomes.
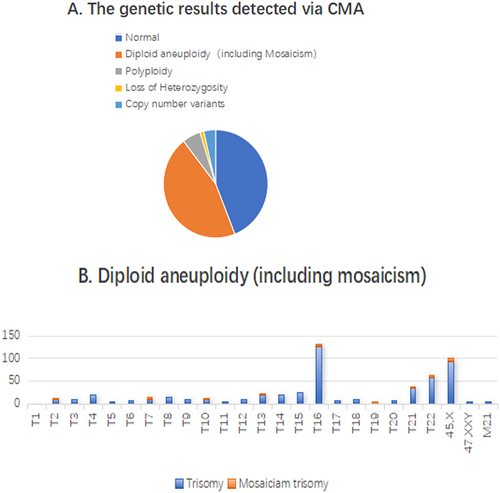
Table 1 The Results of Mosaic
Table 2 The Results of Polyploidy
Table 3 The Results of Uniparental Disomy
Table 4 The Frequency of Abnormality Types in Maternal Age Groups
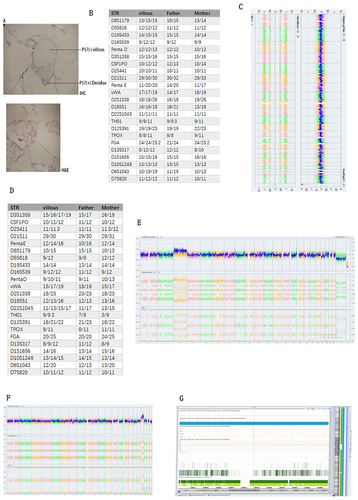
Figure 2 (A) IHC and H&E stained results illustrated molar mole of the villous (B) STR results showed it was paternal molar mole (C) CMA results showed it was whole genome mosaic uniparental disomy. (D) and (E) showed here that this villous was chimera, its CMA results was arr(X)×1~2,(Y)×0~1,(3)×2~3,(1,2,4–22)×2 chi. STR results revealed that this sample was heterologous chimera from parental and maternal origin. (F and G) showed here that this villous was T19 mosaic.
Data Sharing Statement
All data generated during and analyzed during the current study are available upon request by contact the corresponding author.