Figures & data
Figure 1 Perioperative X-rays of a femoral non-union.
Notes: Before non-union treatment according to the diamond concept (A) and 6 months postoperatively when consolidation was achieved (B). The intramedullary nail was removed, the non-union resected and the gap was filled with ABG (autologous bone graft), 3.3 mg BMP-7 and a tricalcium phosphate bone graft (Vitoss; Stryker, Duisburg, Germany). Re-osteosynthesis was performed with an angled blade plate.
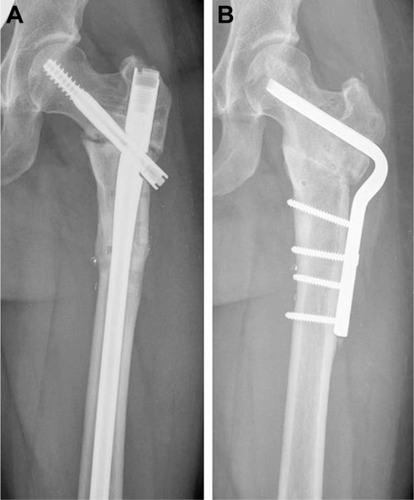
Figure 2 Groups of matched patients: G1 – treatment with BMP-7 and autologous bone graft (ABG) according to the diamond concept, G2 – treatment with ABG alone.
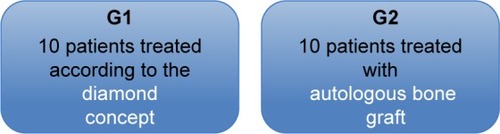
Table 1 Characteristics of study patients who were matched into pairs
Figure 3 Timeline of sample acquisition according to a standardized cytokine protocol.
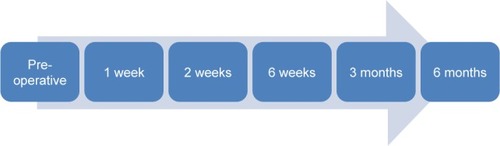
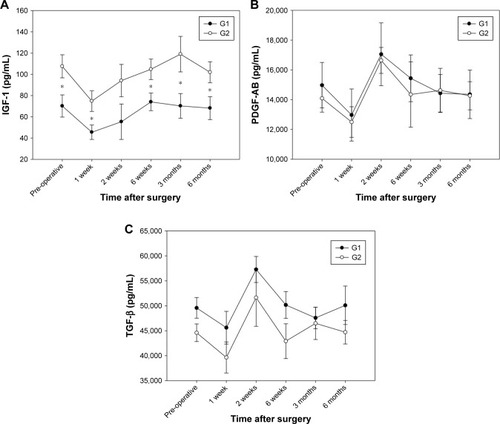
Figure 4 Analysis of sequential IGF-1 (A), PDGF-AB (B) and TGF-β (C) expression levels of G1 (autologous bone graft with additional BMP-7) and G2 (autologous bone graft alone) groups expressed as absolute mean concentrations ± standard deviation.
Notes: Serum concentration was measured in picograms per milliliter (pg/mL). The Wilcoxon’s signed-rank test assessed significant differences between both groups at each particular time point (*indicates significant differences, p<0.05).