
Figures & data
Table 1 Baseline characteristics of SBS–IF patients in the STEPS trial
Table 2 Prediction models for response to teduglutide and placebo
Figure 1 Difference in response between teduglutide and placebo in potential subpopulations.
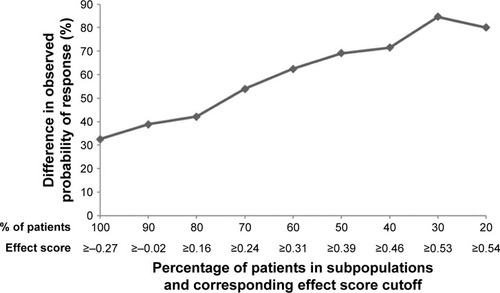
Figure 2 Response in potential subpopulations by treatment.
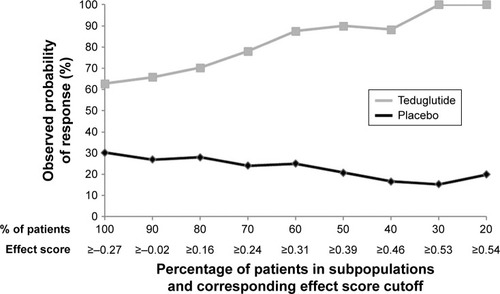
Figure 3 Efficiency frontier.
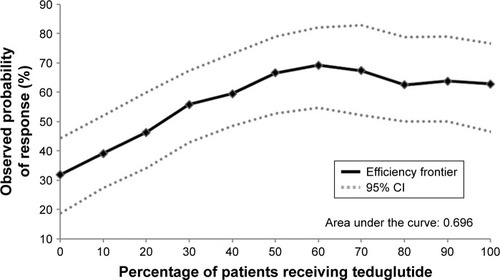
Table 3 Comparison of baseline characteristics in the higher- and lower-response subpopulations
Table 4 Comparison of clinical outcomes between teduglutide and placebo in subpopulations
Figure S1 Illustration of subpopulation identification based on effect score.a
Notes: aPatients were ranked by their individual effect scores from highest to lowest and were sequentially grouped together as potential subpopulations by 10% increments, starting from the top 20% of patients with the highest individual effect score, until all patients (100%) were included.
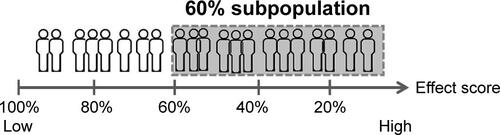
Table S1 List of Independent Ethics Committees or Institutional Review Boards that approved the study