
Figures & data
Figure 1 Flow chart for subject selection process.
Notes: From 2000 to 2013, 7,662 patients diagnosed with RA, SLE, psoriasis, Sjögren’s syndrome, scleroderma, or polymyositis were identified in the NHIRD. A total of 6,541 patients were eligible for subsequent analysis after exclusion. After propensity score matching, 1,993 subjects were assigned to each group. A total of 1,112 patients were excluded: 1) 189 patients for incomplete demographics, 2) 160 patients for being an age of <18 or >100 years, 3) 194 patients for having a previous cancer, and 4) 578 patients for having a follow-up period of ≤1 year.
Abbreviations: HCQ, hydroxychloroquine; NHIRD, National Health Insurance Research Database.
Abbreviations: HCQ, hydroxychloroquine; NHIRD, National Health Insurance Research Database.
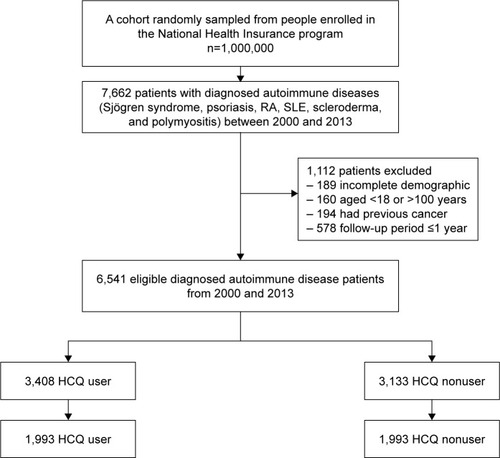
Table 1 Demographics and clinical characteristics of the study population
Figure 2 Kaplan–Meier curves for cumulative incidence of cancer, HCQ nonuser and user.
Note: No significant different cumulative incidence of cancer between HCQ user and nonuser.
Abbreviation: HCQ, hydroxychloroquine.
Abbreviation: HCQ, hydroxychloroquine.
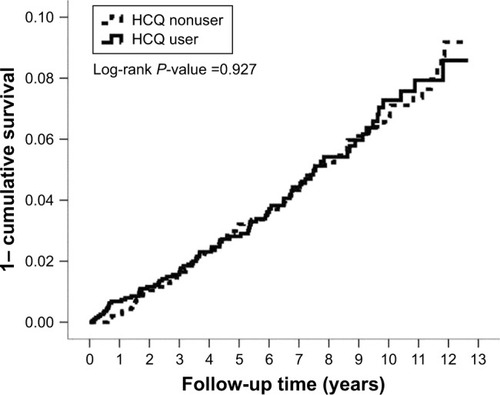
Figure 3 Kaplan–Meier curves for cumulative incidence of cancer with various cDDDs of HCQ.
Note: The incidence of cancer was not significantly increased in larger cDDD of HCQ group.
Abbreviations: cDDDs, cumulative defined daily doses; HCQ, hydroxychloroquine.
Abbreviations: cDDDs, cumulative defined daily doses; HCQ, hydroxychloroquine.
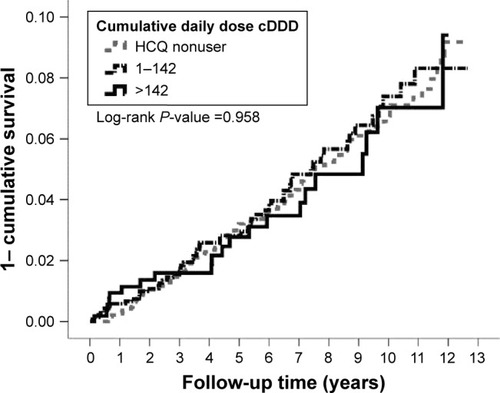
Figure 4 Kaplan–Meier curves for cumulative incidence of cancer with various prescribed daily dose of HCQ.
Note: Prescribed daily dose did not affect the incidence of cancer significantly.
Abbreviation: HCQ, hydroxychloroquine.
Abbreviation: HCQ, hydroxychloroquine.
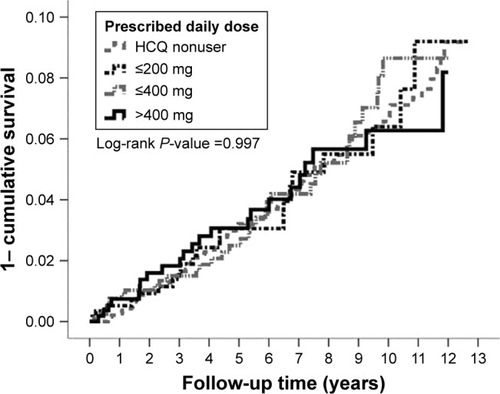
Table 2 Incidences and hazard ratios of cancer in hydroxychloroquine users compared with nonusers
Table 3 Results of subgroup analysis for cancer incidence of HCQ users and nonusers stratified by various confounders
Table 4 Risk of solid cancer and hematological cancer
Table 5 Results of sensitivity analyses