Figures & data
Figure 1 Schematic overview of the whole study.
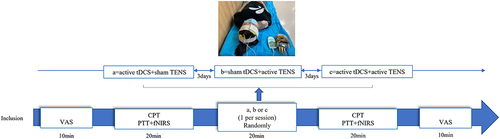
Figure 2 (A) Neurometer CPT/C sensory neuroquantitative assay. (B) The electrode is placed on the affected shoulder.
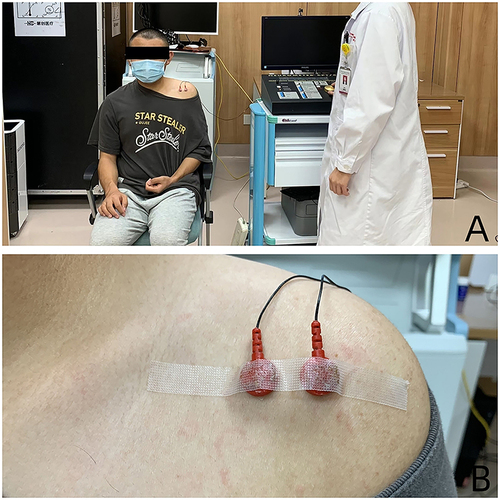
Figure 3 (A) Scene of fNIRS testing. (B) Brain localization schema of channels. (C) fNIRS testing procedure.
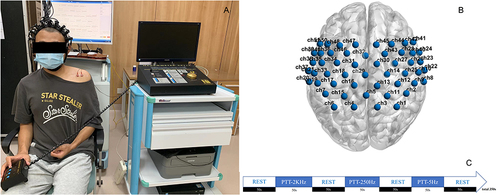
Table 1 Demographics and Baseline Evaluations
Table 2 Visual Analogue Scale Values Before and After Intervention in the Three Groups (Intra-Group and Inter-Group Differences)
Figure 4 (A) Changes in Visual Analogue Scale Values between post and pre stimulation. (B) Changes in current perception threshold and pain tolerance threshold between post and pre stimulation. (C) Changes in the average HbOμm of channel 38 when performing PTT2K between post and pre stimulation.
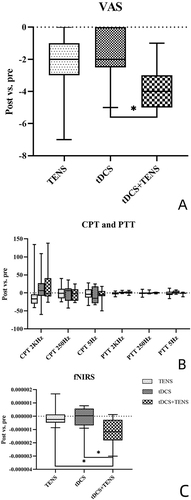
Table 3 Sensory and Pain Thresholds Measurements Before and After Intervention in the Three Groups (Intra-Group and Inter-Group Differences)
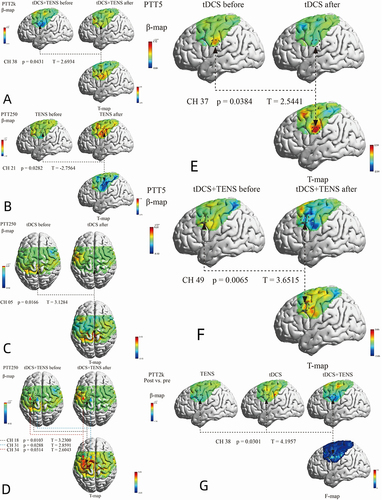
Figure 5 (A) Comparison of changes before and after tDCS+ TENS stimulation in brain activation when performing PTT 2 KHz. (B) Comparison of changes before and after TENS stimulation in brain activation when performing PTT 250 Hz. (C) Comparison of changes before and after tDCS stimulation in brain activation when performing PTT 250 Hz. (D) Comparison of changes before and after tDCS+ TENS stimulation in brain activation when performing PTT 250 Hz. (E) Comparison of changes before and after tDCS stimulation in brain activation when performing PTT 5 Hz. (F) Comparison of changes before and after tDCS+ TENS stimulation in brain activation when performing PTT 5 Hz. (G) Comparison of difference in brain activation when performing PTT 2 KHz task immediately after stimulation.