
Figures & data
Table 1 Baseline and Preoperative Clinical Characteristics of All Patients
Table 2 Primary Outcome: Comparison of Effective Rate of Intraoperative SBP Control Between Diazepam and Placebo Group
Figure 1 Kaplan–Meier survival plot of diazepam group and placebo group according to effective BP control. Patients in the diazepam group (dashed line) had significantly higher effective BP rates during the surgery than patients in the placebo group (solid line) (P = 0.0146).
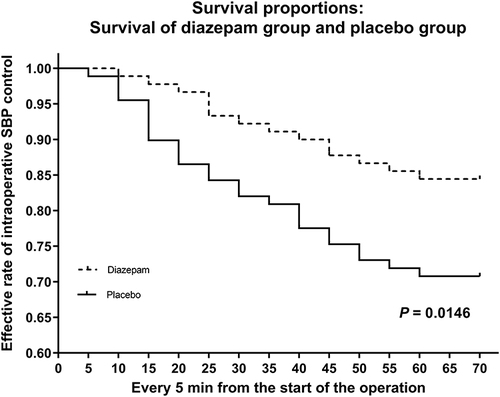
Table 3 Secondary Outcomes: Comparison of Diazepam and Placebo Group
Table 4 Comparison of Clinical Characteristics Between the Effective BP Control Group and Ineffective BP Control Group
Table 5 Logistic Regression Analysis of Risk Factors for Ineffective BP Control