Figures & data
Figure 1 Patient flow and enrollment chart.
Abbreviations: IM, intramuscular; IV, intravenous.
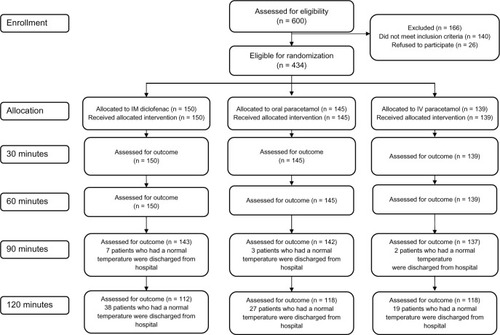
Table 1 Baseline demographic and clinical characteristics of enrolled patients
Figure 2 Mean temperatures at different time points for the three treatment groups.
Abbreviation: IV, intravenous.
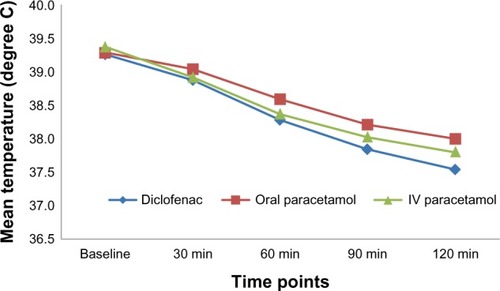
Table 2 Comparison of mean temperature at different time points between the three treatment groups
Table 3 Between-treatment comparisons of mean change from baseline in temperatures at different time points