Figures & data
Figure 1 Study design.
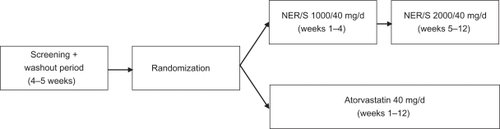
Table 1 Demographics and baseline characteristics
Figure 2 Lipid efficacy from baseline to week 12. For total-C:HDL, non-HDL-C, LDL-C and HDL-C: Bars represent least square means, error bars are standard errors; For TG and Lp(a): Bars represent medians, error bars are [Q1, Q3].
Abbreviations: Total-C, total cholesterol; HDL-C, high-density lipoprotein cholesterol; Non-HDL-C, non-high-density lipoprotein cholesterol; LDL-C, low-density lipoprotein cholesterol; TG, triglycerides; Lp(a), lipoprotein(a); NER/S, niacin extended-release/simvastatin; [Q1, Q3], [25th percentile, 75th percentile].
![Figure 2 Lipid efficacy from baseline to week 12. For total-C:HDL, non-HDL-C, LDL-C and HDL-C: Bars represent least square means, error bars are standard errors; For TG and Lp(a): Bars represent medians, error bars are [Q1, Q3].](/cms/asset/330ccb79-48b0-4f27-b291-0d0a67586382/dvhr_a_14053_f0002_b.jpg)
Figure 3 Percent of patients who attained Apo B < 80 mg/dL at week 12.
Abbreviations: NER/S, niacin extended-release/simvastatin; Apo, apolipoprotein.
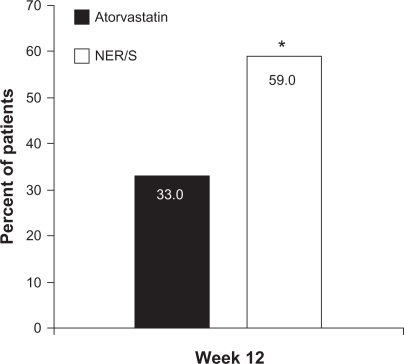
Figure 4 Median percent change in Apo A-1, Apo B, and the Apo B:A-I ratio at final visit. Error bars are [Q1, Q3].
Abbreviations: NER/S, niacin extended-release/simvastatin; Apo, apolipoprotein.
![Figure 4 Median percent change in Apo A-1, Apo B, and the Apo B:A-I ratio at final visit. Error bars are [Q1, Q3].](/cms/asset/82aa5be6-1625-49b8-80e5-c44b0194279a/dvhr_a_14053_f0004_b.jpg)
Figure 5 Median percent change in LDL and VLDL particle size from baseline to week 12. Error bars are [Q1, Q3].
Abbreviations: LDL, low-density lipoprotein; VLDL, very low-density lipoprotein; NER/S, niacin extended-release/simvastatin; [Q1, Q3], [25th percentile, 75th percentile].
![Figure 5 Median percent change in LDL and VLDL particle size from baseline to week 12. Error bars are [Q1, Q3].](/cms/asset/5383d25a-cf17-45ec-9720-5e4af8a3c307/dvhr_a_14053_f0005_b.jpg)
Figure 6A Median percent change in LDL particle numbers from baseline to week 12. Error bars are [Q1, Q3].
Abbreviations: LDL, low-density lipoprotein; IDL, intermediate-density lipoprotein; NER/S, niacin extended-release/simvastatin; [Q1, Q3], [25th percentile, 75th percentile].
![Figure 6A Median percent change in LDL particle numbers from baseline to week 12. Error bars are [Q1, Q3].](/cms/asset/a0b8d741-83ca-4a0d-9b99-86bcb190e968/dvhr_a_14053_f0006_b.jpg)
Figure 6B Median percent change in VLDL particle numbers from baseline to week 12. Error bars are [Q1, Q3].
Abbreviations: VLDL, very low-density lipoprotein; NER/S, niacin extended-release/simvastatin; [Q1, Q3], [25th percentile, 75th percentile].
![Figure 6B Median percent change in VLDL particle numbers from baseline to week 12. Error bars are [Q1, Q3].](/cms/asset/0357146f-bfbd-4467-b319-f07c4070085f/dvhr_a_14053_f0007_b.jpg)
Figure 7 Shift in LDL particle size from baseline to week 12. Error bars are 95% confidence intervals.
Abbreviations: LDL, low-density lipoprotein; HDL, high-density lipoprotein; NER/S, niacin extended-release/simvastatin.
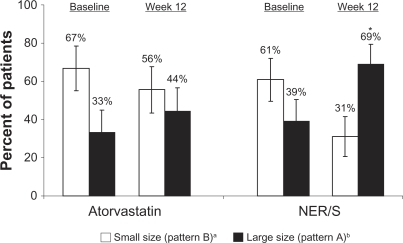
Table 2 Summary of adverse events