
Figures & data
Table 1 Anthropometric and Biochemical Characteristics According to the Metabolic Condition
Table 2 Dietary Intake to the Metabolic Obesity Phenotypes
Figure 1 Compare body adiposity index between metabolical obesity phenotype. The asterisk (*) indicates a significant difference between two groups.
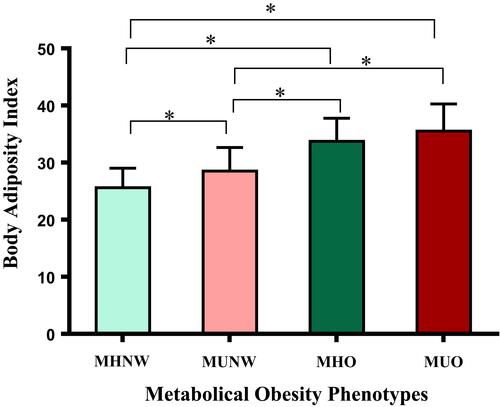
Figure 2 Compare a body shape index between metabolical obesity phenotype. The asterisk (*) indicates a significant difference between two groups.
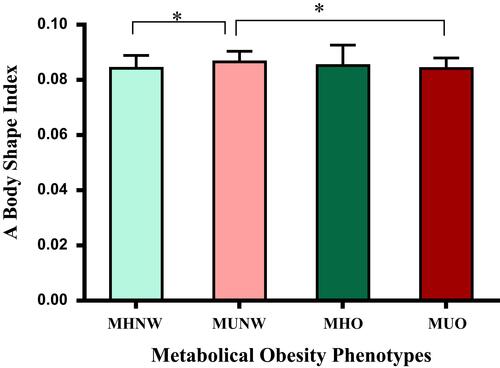
Figure 3 Compare weight-adjusted-weight index between metabolical obesity phenotype. The asterisk (*) indicates a significant difference between two groups.
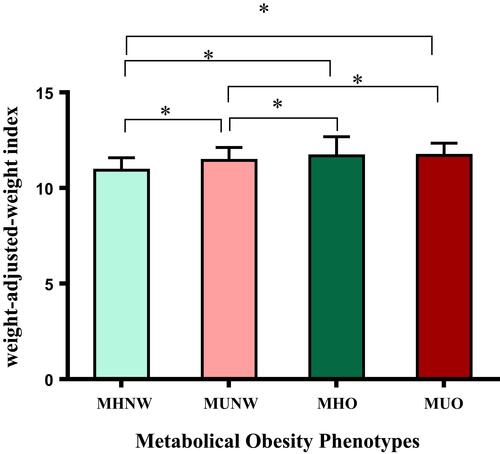
Figure 4 Compare atherogenetic index of placema between metabolical obesity phenotype. The asterisk (*) indicates a significant difference between two groups.
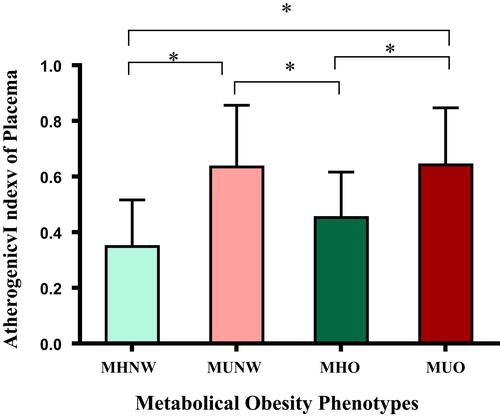
Figure 5 Compare lipid accumulation product between metabolical obesity phenotype. The asterisk (*) indicates a significant difference between two groups.
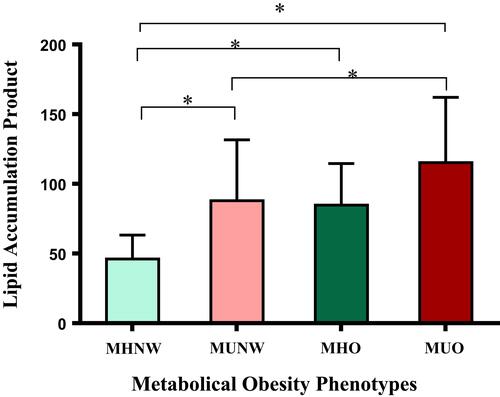
Figure 6 Compare cardiometabolic index between metabolical obesity phenotype. The asterisk (*) indicates a significant difference between two groups.
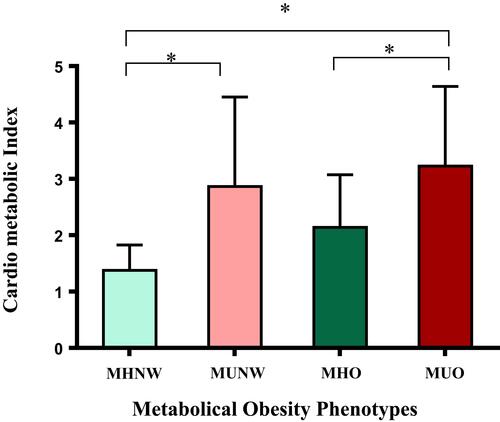
Table 3 FTO (Rs9939609) Genotypes Frequency in Groups
Table 4 Odds Ratios for Cardiometabolic Index, Atherogenic Index of Plasma and Novel Anthropometric Indices Based Metabolic Obesity Phenotypes