Figures & data
Table 1 Selected fatty acid composition of omega-3 and placebo capsule
Figure 1 Study’s flow chart.
Notes: All patients at the Great Lake Dialysis clinic (n = 105) were screened for eligibility. Sixty-nine patients met the inclusion criteria but six of them declined to participate. The remaining 63 patients were randomized into omega-3 and placebo groups and underwent intervention for 6 months. Seven additional subjects (placebo, n = 4; omega-3, n = 3) were excluded from data analysis due to death (n = 4, 2 from each group) or hospitalization (n = 3). Two patients voluntarily dropped out as they were unable to swallow the capsules but their data were included in the analysis (intent to treat).
Abbreviation: MIS, malnutrition-inflammation score.
Abbreviation: MIS, malnutrition-inflammation score.
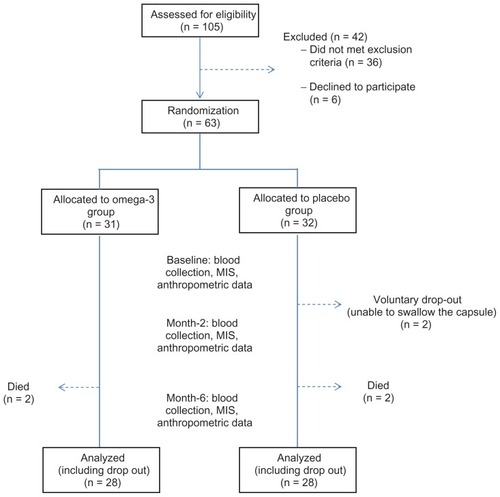
Table 2 Clinical and demographic characteristics of the study population
Table 3 Means and standard deviations of lipid profiles (TC, HDLC, LDLC, and TAG) at baseline and month-6
Table 4 Means and standard deviations of nutritional status indicators (Ser alb, Hgb, MIS score, nPNA, and BMI) at baseline and month-6
Table 5 Means and standard deviations of inflammatory indicators (NFκB, CRP) at baseline and month-6