Figures & data
Figure 1 (A) The viability of HUVEC cells stimulated for 20 h with PA alone or in combination with LPS and IS relative to the negative control (untreated cells) or vehicle control (VC; PA solvent). The results are the mean ± SD of three repeats performed in eight wells each. (B) Representative images of HUVECs morphology after treatment with PA alone and combined with LPS and IS. The actin cytoskeleton of endothelial cells was stained with phalloidin-FITC and the cell’s nuclei with DAPI. Fluorescence microscope, magnification 400x.
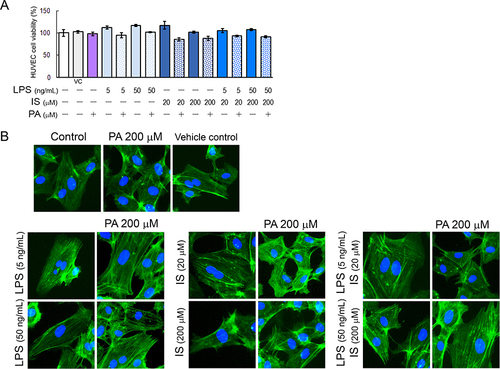
Figure 2 ROS (A) and NO (B) generation in HUVECs treated with PA, LPS, and IS for 4 h. Statistically significant differences vs control *p < 0.05; vs vehicle control (VC) #p < 0.05; with vs without PA &p < 0.05.
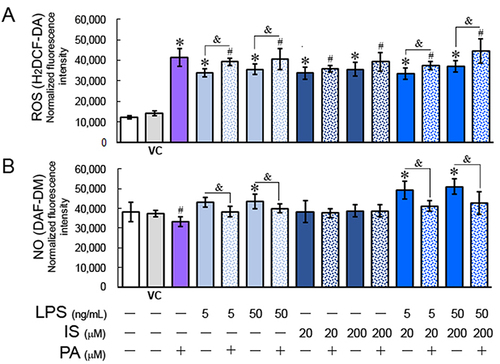
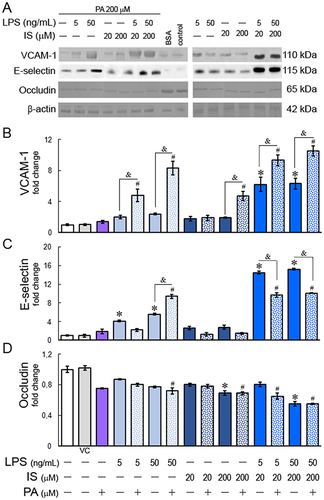
Figure 3 Expression of adhesive molecules and occludin in HUVEC cells treated with LPS, IS, and PA. (A) Western-bott results; (B–D) The band signal strength of VCAM-1, E-selectin, and occludin. The band signal strength of controls (untreated and vehicle-treated cells) was set to 1, and the values were normalized to β-actin levels. Statistically significant differences vs control *p < 0.05; vs VC #p < 0.05; with vs without PA &p < 0.05.