Figures & data
Figure 1 Flowchart of the study.
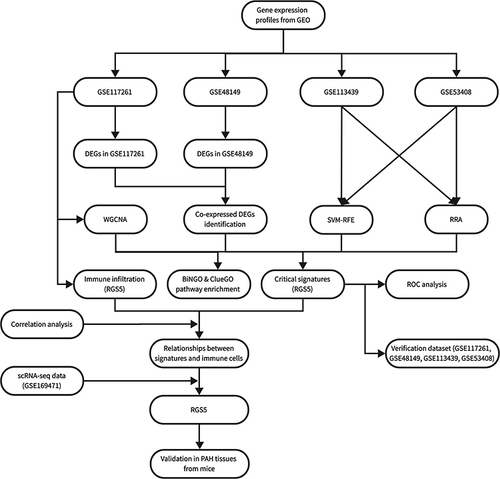
Figure 2 WGCNA co-expression network of immune-related genes. (A) PCA cluster plot of gene expression profile in PAH and control samples in GSE117261. (B) Optimal soft-threshold power. (C) Dendrogram based on a dissimilarity metric for DEGs. (D) Module-trait relationships between WGCNA modules and clinical traits. (Ea and Eb) Scatter plots of key modules.
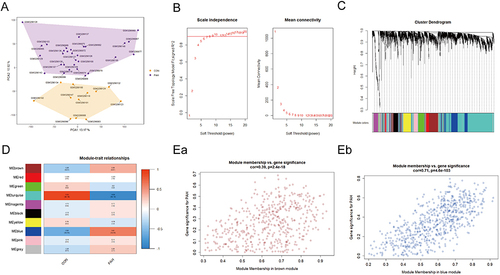
Figure 3 GO enrichment analysis of module genes. (A) A sample BiNGO result for a set of PAH-associated module genes as visualized using Cytoscape. Dark Orange categories are most significantly over-represented. White nodes are not significantly over-represented, they are included to show the Orange nodes in the context of the GO hierarchy. The area of a node is proportional to the number of genes in the test set annotated to the corresponding GO category. BP (Aa); CC (Ab); MF (Ac). (B) ClueGO example analysis of upregulated PAH-associated module genes. Functionally grouped network with terms as nodes linked based on their kappa score level (=0.4), where only the label of the most significant term for each group is shown. The node size represents the term enrichment significance. BP (Ba); CC (Bb); MF (Bc).
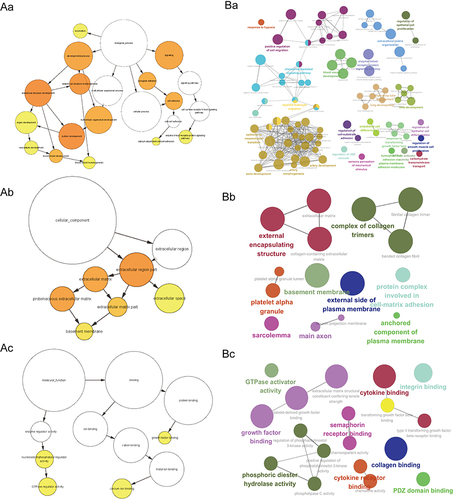
Figure 4 Identification of DEGs. (Aa and Ab) Volcano plots of DEG distribution in GSE117261 (Aa) and GSE48149 (Ab). Nodes in red represent upregulated genes, nodes in blue represent downregulated genes, and gray dots represent not significantly altered genes. (B) Number of DEGs in GSE117261 and GSE48149. (C) Venn diagram of DEGs from the two datasets. (Da and Db) Heatmaps of DEGs in GSE117261 (Da) and GSE48149 (Db). The legend on the top right indicates the log fold change of the genes. The horizontal axis represents each sample and the vertical axis represents each gene. Black (Grey) and yellow (purple) colors represent low and high expression values, respectively. (E) Top elements (red, upregulated; green, downregulated) available in input rankings correctly identified by RRA in GSE113439 and GSE53408. (Fa and Fb) SVM-RFE algorithm to screen diagnostic markers of GEO2R analysis genes. (G) Venn diagram showing the intersection of the critical signature obtained using the four strategies.
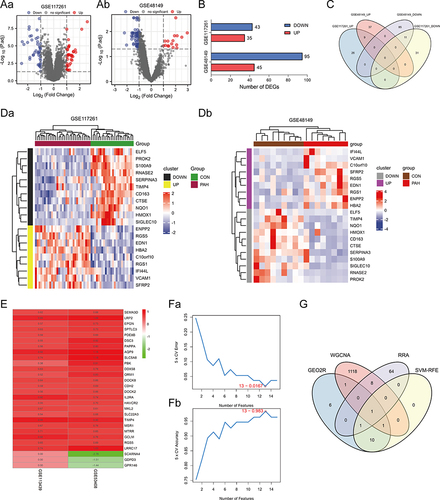
Table 1 Information of RGS5
Figure 5 (Aa–Ad) Diagnostic power of RGS5 in PAH in ROC curve analysis ((Aa), GSE48149; (Ab), GSE53408; (Ac), GSE113439; (Ad), GSE117261). (Ba–Bd) Expression levels of RGS5 in GSE series ((Ba), GSE48149; (Bb), GSE53408; (Bc), GSE113439; (Bd), GSE117261). *P<0.05, **P<0.01, ***P<0.001.
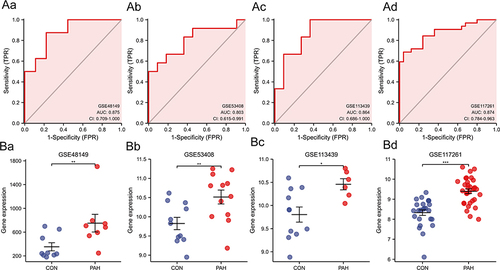
Figure 6 Immune cell infiltration analysis, and relationships between the key signature and immune cells in PAH. (A) Box-plot of the proportion of 22 types of immune cells. *P<0.05, **P<0.01, ***P<0.001. (B) Heatmap of correlation between RGS5 levels and 21 types of immune cells. Red represents a positive correlation and blue represents a negative correlation. A darker color implies a stronger association. *P<0.05, **P<0.01.
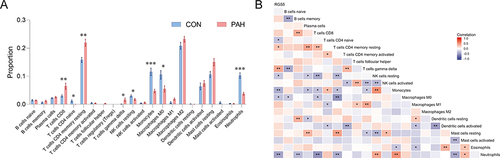
Figure 7 Identification of cell type of RGS5 expression in endothelial cells in human PAH tissues. (A and B) Quality control of single-cell RNA sequencing for control and PAH sub-populations. The y-axes represent RNA numbers, RNA counts and percentage of mitochondria of each cell, respectively. Cells with poor quality were filtered out and the detected gene counts and sequencing depth in sub-populations were analyzed. (C) tSNE visualization of cell type in lung tissues of several cell types. (D) tSNE visualization of cell type in lung tissues of controls and patients with PAH. (E) tSNE plot showing the distribution of expression of the marker gene RGS5 in lung tissues of several cell types (blue, high; gray, low). (F) Violin plots showing expression distribution of RGS5 mRNA in different cell clusters in control and PAH tissues.
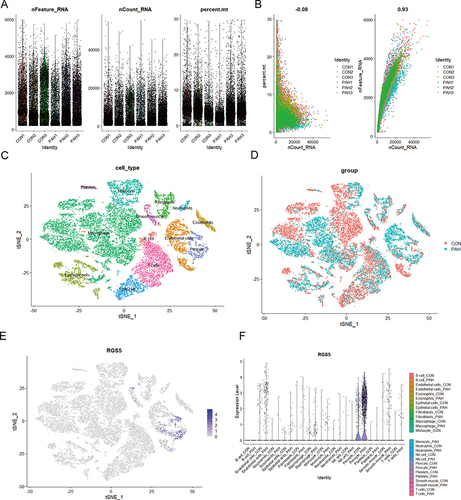
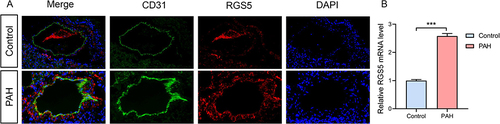
Figure 8 RGS5 expression in PAH. (A) An Immunofluorescence staining of the pericyte marker (CD31) and RGS5 in pulmonary microvasculature of PAH mice. (B) Relative RGS5 mRNA expression in normal lung and PAH mouse samples. ***P<0.05.